How many red dwarfs?
Huge stars are rare. And tiny stars (mostly red dwarfs) are numerous in our Milky Way galaxy. Astronomers believe this is true. But it’s based on an assumption … that what we see in nearby space holds true in larger volumes of space, and perhaps throughout the galaxy. We don’t know for sure because we can’t see tiny stars at great distances from our sun. Far from our sun, only the luminous giant stars are noticeable.
Meanwhile, most of the unaided-eye stars we see in our sky – most of the familiar stars for which we have names – are relatively large in contrast to red dwarfs. They are distant and not typical of the total range of star masses and sizes, thought to exist in our Milky Way. A section on the Nearest Stars in my book Astronomical Companion labors this point. So … how many red dwarf stars are there? And is the neighborhood around our sun typical?
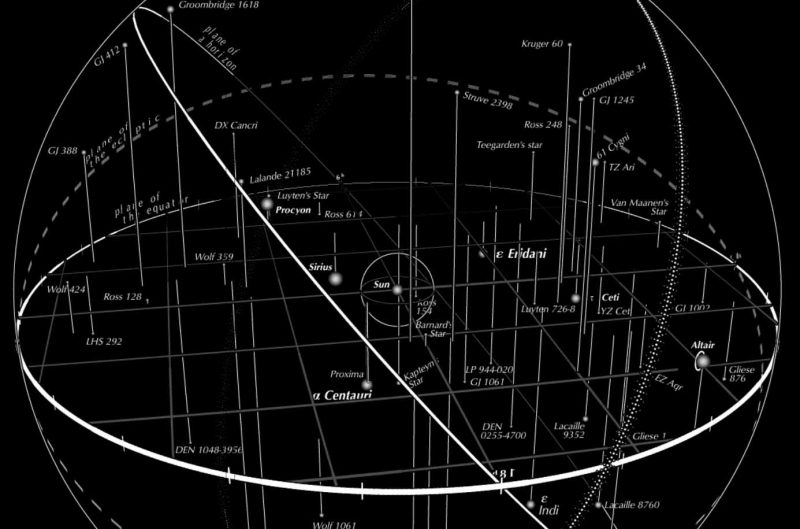
It occurred to me that I could illustrate star masses by showing the Astronomical Companion‘s nearest-stars picture. You will see that picture above. It shows a sphere of space with radius 16 light-years. Now compare the image above with the illustration below. The second illustration shows a somewhat more-distant shell of space, 90 light-years in radius.
So … above we have an illustration showing a sphere of space 16 light-years in radius. And below we have a disk-shaped block of space 90 light-years in radius and 10 light-years thick.
Does the density of small red dwarf stars hold true for both?
Plotting the data: How we know
The European Space Agency’s Hipparcos satellite – which flew from 1989 to 1993 (I had to buy it on disks from the Netherlands) – must come close to containing all the stars that inhabit the 90-light-year volume of space, illustrated above.
So by plotting all of the stars measured by Hipparcos, not just those above a certain visibility, we would show the density of stars in our nearby space. And we’d see if the ratio of rare giants to teeming midgets holds as true for a region with a 90-light-year radius, as for a region with a 16-light-year radius.
The difficulty in plotting this was that a picture of the same kind, with stalks connecting each star to a plane so that we can see how they are arranged in space, would be an unintelligible forest of stalks. So – instead of making the same sort of illustration for both 16 and 90 light-years – I tried a view from galactic north, with stars limited to a wedge in declination – included only if within 10° of the celestial equator.
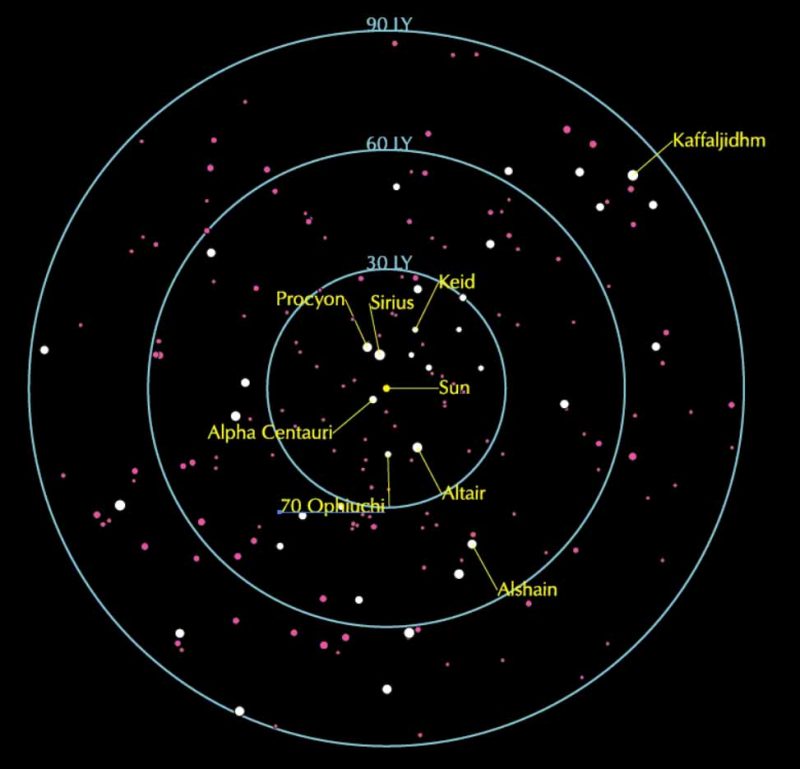
Eventually, the picture evolved to the chart you see above.
It’s a view from galactic north: looking down on the plane of our Milky Way galaxy. Not actually the mid-plane, but the plane in which the sun lies (which is an uncertain distance, maybe 30 light-years, north of the galaxy’s real median plane). We see stars out to 90 light-years from us, but only those that are within 5 light-years north or south of this sun’s plane.
So we are looking at a disk-shaped block of space 90 light-years in radius and 10 light-years thick.
Comparing the 2 charts: What we see
The density of stars does look consistent between the two charts on this page: similar in our closer neighborhood and in the more distant parts. But there are differences.
Consider that – in the 90-light-year-radius chart – the dots for the stars are sized for their absolute magnitudes – their true brightnesses – not their apparent magnitudes as seen from Earth. Colored pink are those that actually look fainter to us: those of apparent magnitude 6 or dimmer. Most of the stars in the outer rings are too dim for the unaided eye. But, in the inner region, we do see the few stars that are among the brightest in our sky because they are nearby and are of about the sun’s size or larger: Sirius, Procyon, Alpha Centauri, Altair.
In the outer regions of the 90-light-year-radius chart, it’s hard to find any named stars; I had to lower the magnitude threshold for them to 5 before finding any even with names of the unfamiliar kind that aren’t really used – Kaffaljidhm is a star in Cetus, Keid is in Eridanus, Alshain is in Aquila.
Do the charts reflect the reality?
So does the 90-light-year illustration really show the density of stars in our part of the galaxy? It’s an approach, but probably an understatement.
My program told me it had plotted 187 stars. The Hipparcos satellite produced two sets of data, called Hipparcos and Tycho. Tycho goes down to about three magnitudes dimmer, and has entries for nearly 9 times as many stars, though with shorter lines of information about each. If I make my program read the Tycho set instead, it takes minutes longer, and packs the picture with 19,164 stars!
Are there really so many more faint stars relatively close around us? I’ll probably be returning to this.
Bottom line: Astronomer Guy Ottewell uses 2 charts – showing 2 different volumes of space – to contemplate and question the density of red dwarf stars in our Milky Way.
Like what you read?
Subscribe and receive daily news delivered to your inbox.
More from
Guy Ottewell