Originally published on June 17, 2023, at Guy Ottewell’s blog. Edits by EarthSky.
The equation of time
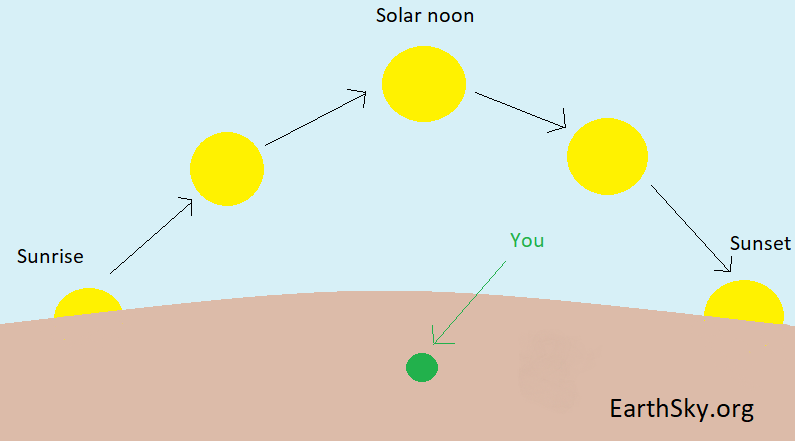
The length of our day is 24 hours. You could look at day length as the average time between local noons, when the sun reaches its highest point in your sky. If you time those crossings with a stopwatch, you will find that the sun sometimes reaches the meridian – a line across your sky from due north to due south, dividing your sky in half – slightly early. And it sometimes crosses the meridian slightly late. So, the observed, or apparent, lengths of the day vary.
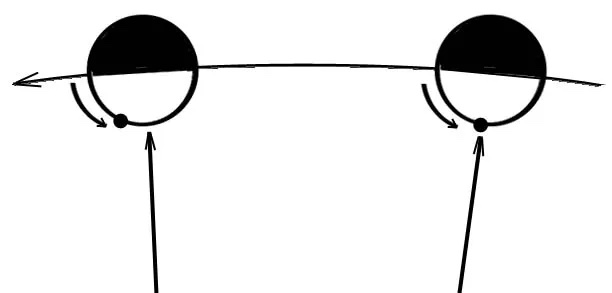
This is partly because the Earth travels slightly faster during the inner half of its slightly elliptical orbit around the sun. That’s when we’re near perihelion – its closest point to the sun in its orbit around January 3 – than in the outer half (aphelion). However, Earth rotates at a constant speed.
Earth’s tilt is a major factor
But the larger reason is Earth’s obliquity: the tilting of its north pole 23.4° away from the sun around the December solstices and toward it around the June solstices. Around the times of the December and June solstices (from early November to early February, and from early May to early August), the sun travels across the lines of right ascension on the map of the sky faster than it is traveling in ecliptic longitude.
Then around the March equinox (from early February to early May), its course slopes north in right ascension. And around the September equinox (from early August to early November) it slopes south, so at those times the sun’s right ascension changes more slowly than its longitude.
Another way of putting it is that, as the sun moves one day’s journey along the ecliptic, it moves more or less than that angular distance in right ascension, which is the measure of when it’s on the meridian at noon.
The difference between apparent solar time (the actual time between noons) and mean solar time (the average time between noons) is called the equation of time. This old use of equation means that by subtracting it from the varying apparent time you equalize that to the average time.
The results: Minima and maxima
The two factors above combine to give a curve showing two minima and two maxima.
The dates can vary slightly from year to year because of leap days. These are the dates for 2020:
February 11 is at minimum for the year -14.24 minutes.
April 15 is 0.
May 13 reaches a shallow maximum of 3.65 minutes.
June 12 is 0.
July 25 reaches a shallow minimum of -6.55 minutes.
September 1 is 0.
November 2 is at maximum for the year, 16.49 minutes.
December 24 is 0.
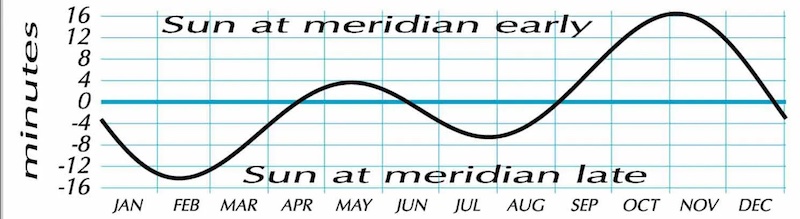
Then, there comes a small maximum in May (at mean noon the sun is 4 minutes past the meridian). Next, it’s followed by a smaller minimum in July (the sun is 7 minutes late reaching the meridian). And a year’s maximum is in November (the sun is 16.5 minutes early crossing the meridian). Finally, the dates in between – April, June, September, December – are when the equation is zero. So the midday sun is on time!
Now factoring in axial tilt and eccentricity
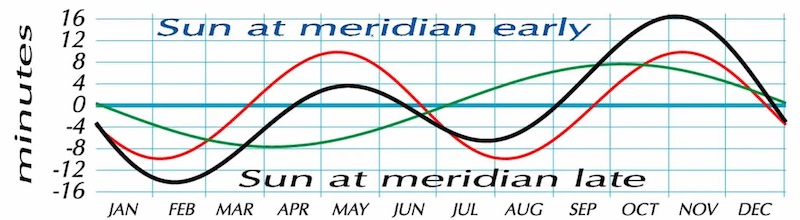
These are the words of friend Anthony Barreiro. He suggested the addition of the curves for the two components, and I can’t improve on his explanation.
You can see why the February minimum and November maximum are extreme, while the May maximum and July minimum are moderate, and also how the equation of time is mostly due to obliquity (axial tilt), with eccentricity pulling it first one way then the other.
Bottom line: Guy Ottewell discusses the difference between apparent solar time (the actual time between noons) and mean solar time (the average time between noons). It’s called the equation of time.
Like what you read?
Subscribe and receive daily news delivered to your inbox.
More from
Guy Ottewell