


Watch NASA’s perpetual ocean video here.
- NASA has created a second perpetual ocean video, building on the incredibly popular original video from 2011.
- The new video traces some of the strongest currents, showing surface ocean currents in white and deeper ocean currents in dark blue.
- The video helps scientists understand the characteristics of these currents better and ultimately understand how heat is transported globally in the ocean.
NASA published this original article on February 27, 2025. Edits by EarthSky.
See the perpetual ocean video
This is a visualization of ocean currents around the world. Scientists use NASA’s ocean model, Estimating the Circulation and Climate of the Ocean (ECCO), to visualize the currents. The ECCO ocean circulation model incorporates observations from spacecraft, buoys and other in situ measurements to keep the model accurate. ECCO is a joint project between NASA/ JPL and MIT. The model output used here is from ECCO-2 and covers the years 2021-2023.
In 2011, ECCO2 was used to create a visualization called Perpetual Ocean. Perpetual Ocean continues to be extremely popular, but it only shows ocean currents on the surface.
In this new visualization, we use the ocean’s 3D velocity field to visualize some of the strongest ocean currents. We release virtual particles in the ocean and allow them to move with the ocean’s 3D velocity field. Each particle has a trail so we can see its direction of movement better. The particles initialized above 600 meters (1,970 feet) in depth have a trail length of three days, those initialized deeper than 600 meters have a trail length of six days. The particle trails help identify the strongest currents in the world that are squeezed in narrow belts on the western side of each ocean basin. These are called western boundary currents.
The looping meanders in the boundary currents sometimes form turbulent rings (eddies) that can trap cold or warm waters in their centers and then separate from the main flow. In general, the western boundary currents are warm and salty.
Read more: Celebrate World Oceans Day today, June 8, 2026
A closer look off the coast of Japan
The visualization starts from a global rotating view. Then, it slows down to see the Western Boundary Current along the western edge of the Pacific Ocean along the coasts of Australia and Asia. We zoom in to show the Kuroshio Current off the coast of Japan. Along the Japanese coast, the current exhibits large meanders that can persist for many months in more or less the same location. The Kuroshio Current has a temperature range of 20 to 25 degrees Celsius (68 to 77 F). Its salinity can change seasonally with an average value of 34.5.
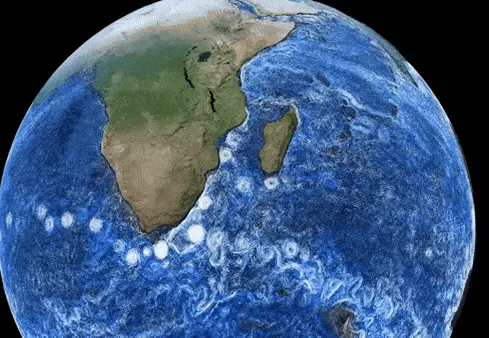
Zeroing in on the Indian Ocean and the southern tip of Africa
We then zoom out and move over the Indian Ocean. The Indian Ocean exhibits large variations in salinity. The western Indian Ocean is quite salty (>36) due to overflow inputs from seas such as the Persian Gulf and the Red Sea. The East Indian Ocean is fresher (~35) due to river inputs from India. The Indonesian Throughflow is quite fresh (33-34) and carries freshwater from the Pacific.
We then zoom into the southern tip of Africa. The exchange of water from the Indian Ocean to the South Atlantic occurs here. The Agulhas Current is another Western Boundary current following the slope of the continental shelf closely. The continental shelf along the east coast of southern Africa is quite narrow and steep. This sloping topography stabilizes the Agulhas Current so that it shows no wide meanderings of the type familiar in other boundary currents such as the Kuroshio.
The Agulhas Current overshoots the African continent, moving into the South Atlantic. It then retroflects back to the Indian Ocean. At the retroflection, shedding of warm (20 to 25 degrees C or 68 to 77 F) and salty (~35.5) rings happens. The eddies detached from the current have a lifetime of more than two years traveling across the South Atlantic Ocean. These eddies are what we call the Agulhas Rings.
The perpetual ocean video aims for North America
Another Western Boundary Current, called the Gulf Stream, comes into view along the east coast of North America. The Gulf Stream forms at the Florida Straits. It’s one of the fastest currents on Earth with surface speed of up to 2.5 meters per second (5.6 mph).
In the Gulf Stream, cold cores (mostly anticyclonic ones) form when the Gulf Stream meanders eastward, leaving the coast of North Ameraica (off Cape Hatteras in North Carolina). The eddy can be as large as 1,000 km (600 miles) across. Zooming into the Gulf Stream, we can see that the warm surface water (>25 degrees C or 77 F) moves poleward (white particle trails). The Gulf Stream is generally the warmest and saltiest western boundary current. There’s a return current (blue particle trails) underneath at a depth below 500 meters (1,640 feet) moving southward carrying cold waters from the pole.
The loop currents in the Gulf of Mexico are very large eddies persisting in the Gulf. They bring the warm and highly saline Caribbean water into the Gulf. As we zoom out from the Gulf Stream, the salinity version shows that the Atlantic is generally much saltier than the Pacific.
Models like ECCO-2 help scientists to understand the characteristics of these currents better and ultimately understand how heat is transported globally in the ocean.
Bottom line: Watch a mesmerizing perpetual ocean video that shows the movements of the currents and eddies that churn off the eastern coasts of the continents.
Like what you read?
Subscribe and receive daily news delivered to your inbox.
More from
EarthSky Voices


