


In 2014, and for the two years before that, Antarctic sea ice set new records at its maximum extent toward the end of southern winter, typically late September or early October. This year, that didn’t happen. Sea ice on the Southern Ocean around Antarctica reached its annual maximum extent on October 6, 2015. The extent was less than the previous three years and fell roughly in the middle of the record of Antarctic maximum extents compiled during the 37 years of satellite measurements.
This year’s maximum extent is both the 22nd lowest and the 16th highest.
Walt Meier, a sea ice scientist at NASA’s Goddard Space Flight Center, said on the NASA Earth Observatory site:
After three record-high extent years, this year marks a return toward normalcy for Antarctic sea ice.
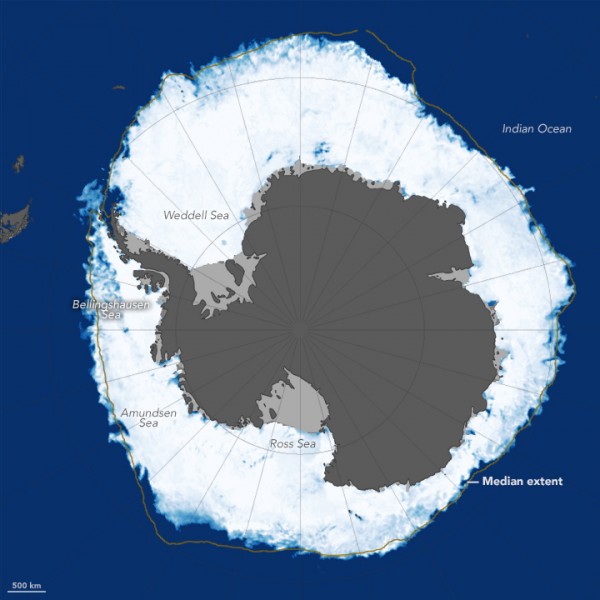
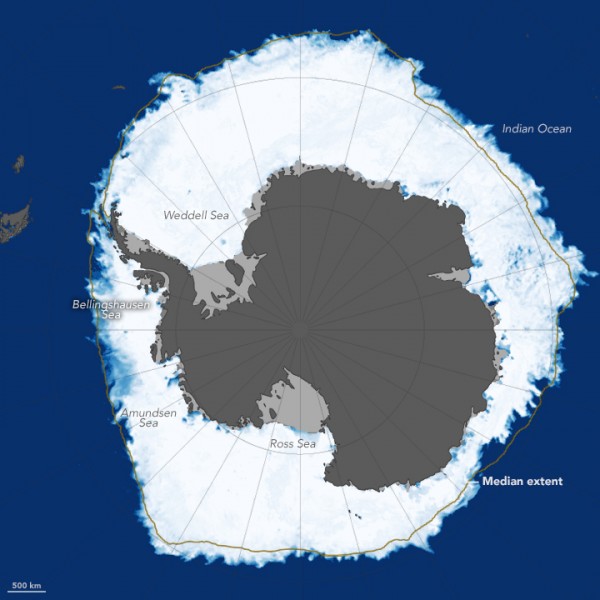
At maximum on October 6, Antarctic sea ice extent measured 7.27 million square miles (18.83 million square km). NASA said:
In 2015, sea ice coverage was greater than average around the Antarctic Peninsula, the Weddell Sea, and the Wilkes Land coast, according to an analysis by the National Snow & Ice Data Center. The Ross Sea and the Indian Ocean-facing coast had below average sea ice.
A story at NASA.gov said:
The growth of Antarctic sea ice was erratic this year: sea ice was at much higher than normal levels throughout much of the first half of 2015 until, in mid-July, it flattened out and even went below normal levels in mid-August. The sea ice cover recovered partially in September, but still this year’s maximum extent is 513,00 square miles (1.33 million square kilometers) below the record maximum extent, which was set in 2014.
Scientists believe this year’s strong El Niño event, a natural phenomenon that warms the surface waters of the eastern equatorial Pacific Ocean, had an impact on the behavior of the sea ice cover around Antarctica. El Niño causes higher sea level pressure, warmer air temperature and warmer sea surface temperature in the Amundsen, Bellingshausen and Weddell seas in west Antarctica that affect the sea ice distribution.
Bottom line: Sea ice around Antarctica did not set a new record for its yearly maximum in 2015, as it has for the past three years. A sea ice scientist called it “a return toward normalcy.” At the same tine, scientists believe this year’s strong El Niño event affected the behavior of the sea ice cover around Antarctica.
Like what you read?
Subscribe and receive daily news delivered to your inbox.
More from
Deborah Byrd


