


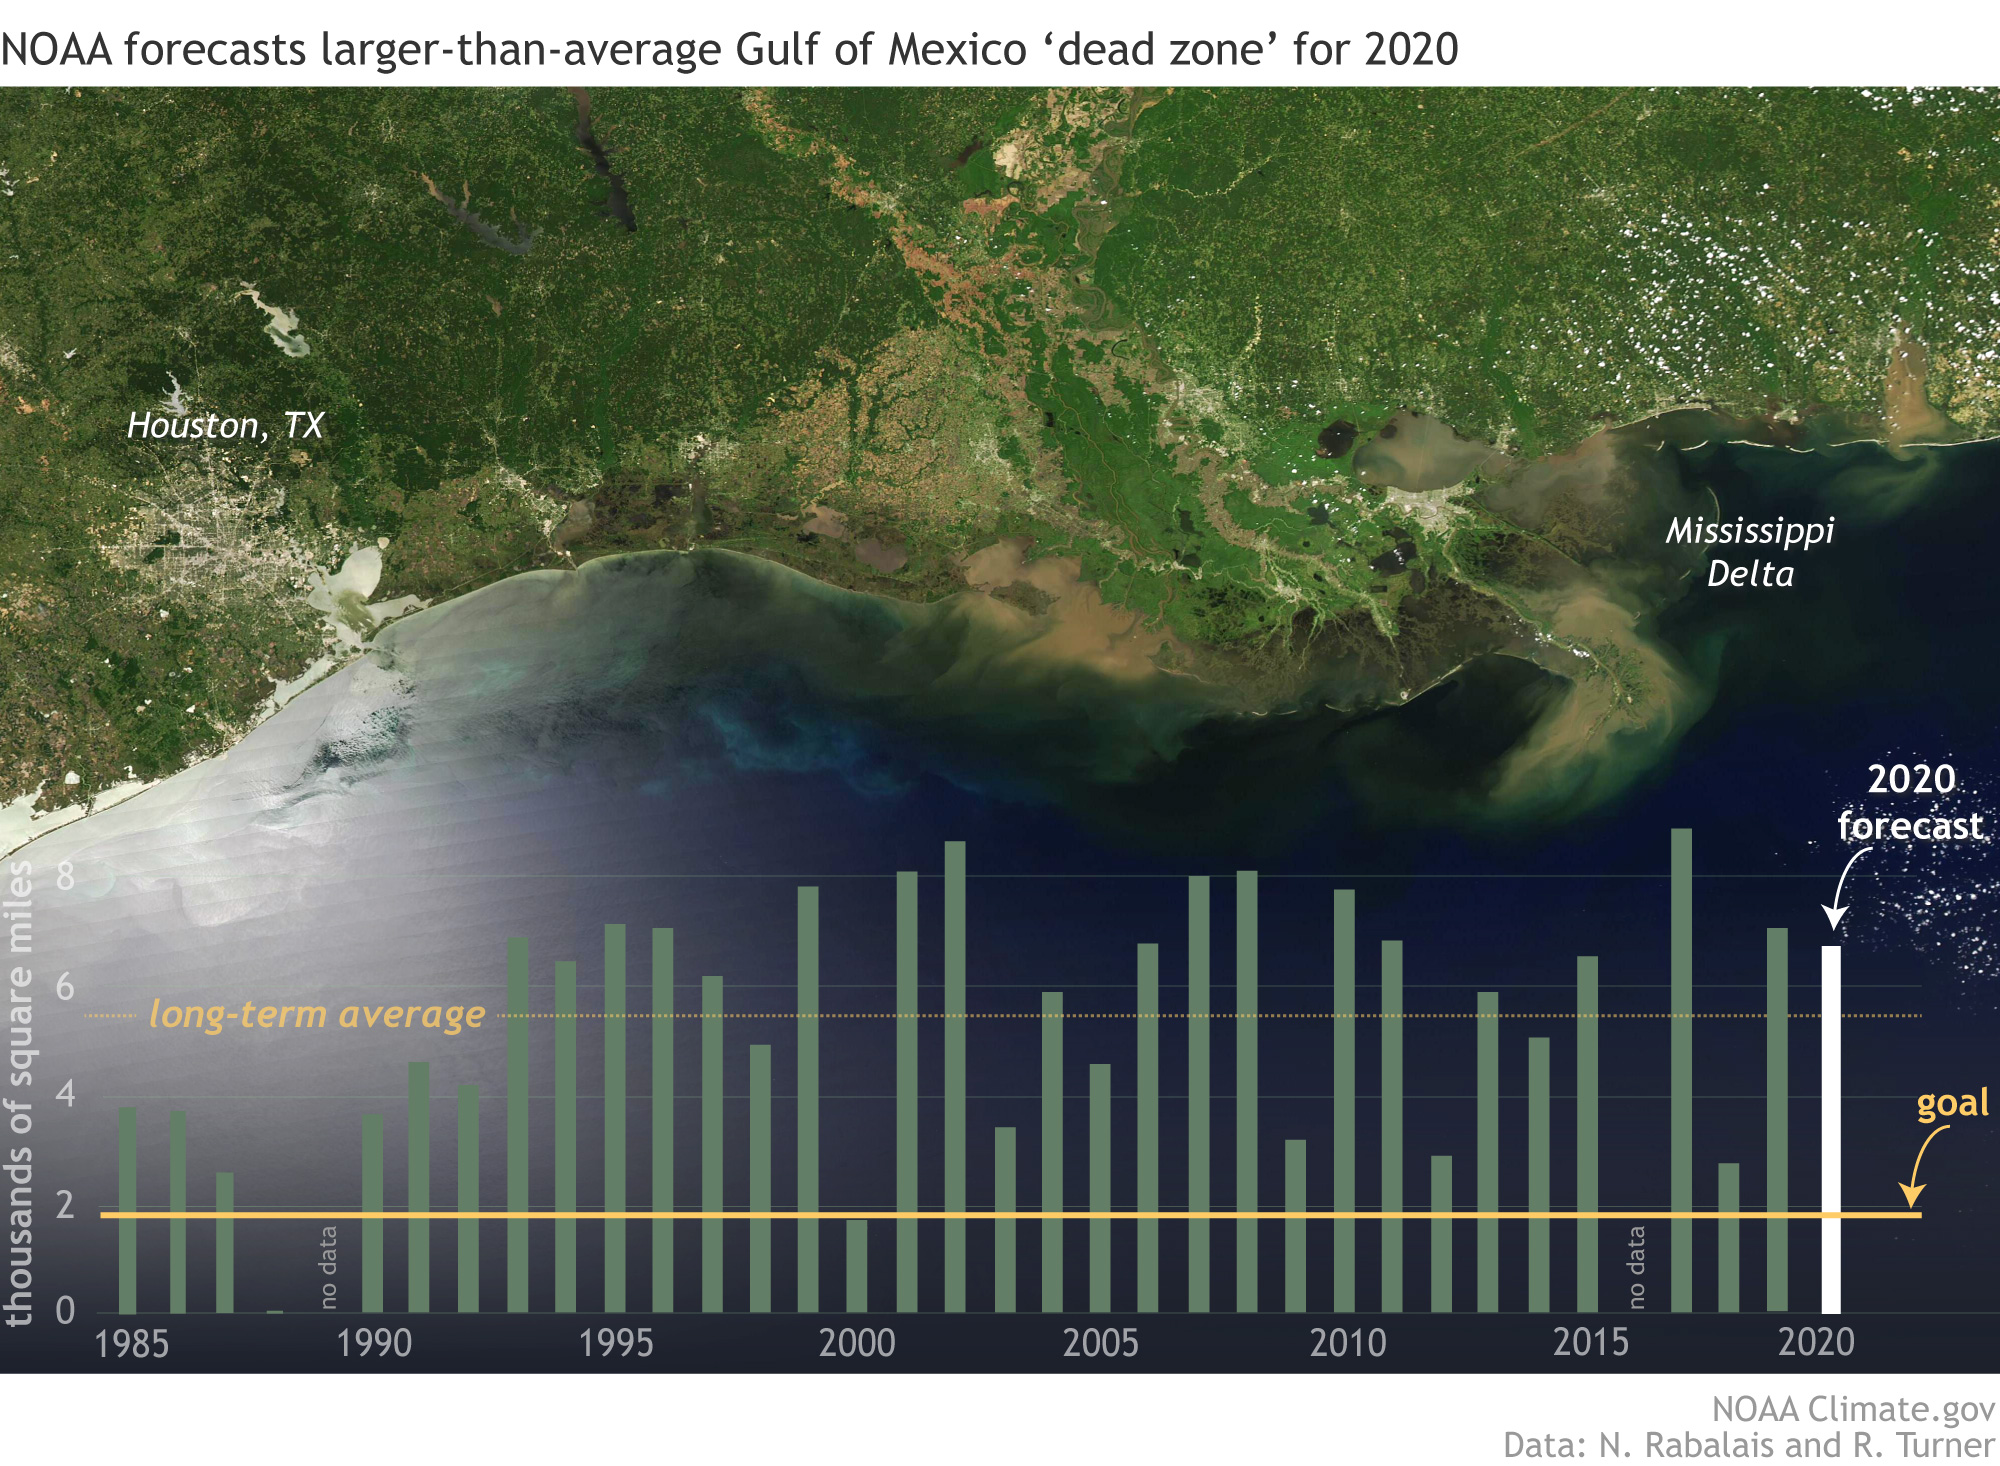
In June, scientists from the National Oceanic and Atmospheric Administration (NOAA) forecast that the 2020 summer Gulf of Mexico hypoxic area or “dead zone” – an area of low to no oxygen that can kill fish and other marine life – will be approximately 6,700 square miles (17,000 square km). That’s larger than the long-term average size of 5,387 square miles (13,952 square km) but substantially less than the record of 8,776 square miles (22,730 square km) set in 2017.
A monitoring survey, scheduled for later this summer, will confirm the size of the 2020 dead zone, and is a key test of the accuracy of NOAA’s models.
The Gulf of Mexico dead zone occurs every summer. It’s primarily caused by excess nutrient pollution from human activities in urban and agricultural areas throughout the Mississippi River watershed. When the excess nutrients reach the Gulf, they stimulate an overgrowth of algae, which eventually die and decompose, depleting oxygen as they sink to the bottom. The resulting low oxygen levels near the bottom of the Gulf cannot support most marine life. Fish, shrimp and crabs often swim out of the area, but animals that are unable to swim or move away are stressed or killed by the low oxygen.
Although the Gulf of Mexico’s dead zone is perhaps the most well-known, there are hypoxic zones in many other places around the U.S. and the world where nutrient runoff contributes to low oxygen. NOAA physical scientist David M. Kidwell told the New York Times:
It’s not unique to the Gulf. It is likely occurring in someone’s back yard, but they don’t know it or have not heard about it yet.
Nicole LeBoeuf is acting director of NOAA’s National Ocean Service. She said in a statement:
The annual dead zone makes large areas unavailable for species that depend on them for their survival and places continued strain on the region’s living resources and coastal economies.
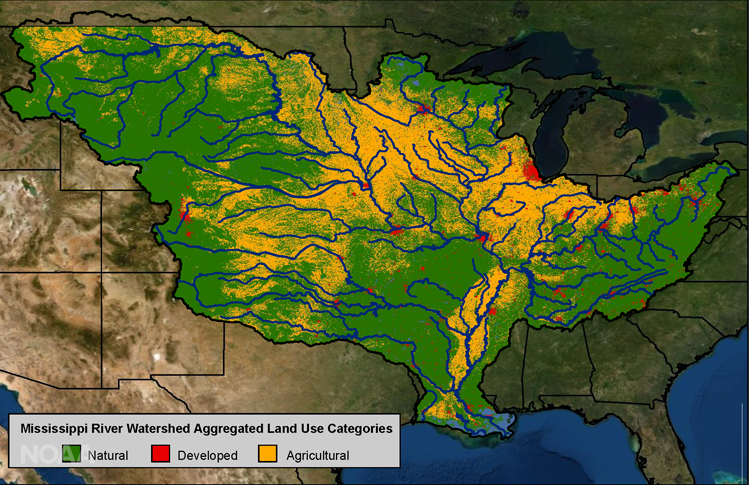
Major factors contributing to this year’s above-average hypoxic zone are the high river flows and nutrient loads delivered to the Gulf this spring, primarily from the Mississippi and Atchafalaya rivers. In May 2020, discharge in the Mississippi and Atchafalaya rivers was about 30% above the long-term average between 1980 and 2019. The USGS estimates that this larger-than average river discharge carried 136,000 metric tons of nitrate and 21,400 metric tons of phosphorus into the Gulf of Mexico in May alone. These nitrate loads were about 2% above the long-term average, and phosphorus loads were about 25% above the long-term average.
Don Cline is associate director for the USGS Water Resources Mission Area. Cline said:
The annually recurring Gulf of Mexico hypoxic zone is primarily caused by excess nutrient pollution occurring throughout the Mississippi River watershed.
According to Michon Scott at Climate.gov:
Since the mid-1980s, the long-term average dead zone size has been 5,387 square miles. Years with smaller dead zones may be linked to dry springs, such as the drought of 1988, or to summers with hurricanes or other wind events that mix the water column in the Gulf, disrupting the low-oxygen waters and driving oxygen-rich surface water down into the depths. The record-setting 2017 dead zone followed an extremely wet spring across the Great Plains and Midwest, while the below-average 2018 dead zone was a result of persistent winds from the west and northwest the weeks preceding the monitoring cruise, pushing the low oxygen water mass to the east and restricting flow across the Louisiana-Texas shelf.
NOAA’s hypoxic zone forecast assumes typical coastal weather conditions, but the actual measured dead zone size could be disrupted and its size could be changed by major weather events, such as hurricanes and tropical storms, which mix ocean waters, as occurred in 2018 and 2019.
Bottom line: A larger-than-average “dead zone” is expected for Gulf of Mexico in summer 2020, according to a NOAA forecast.
Like what you read?
Subscribe and receive daily news delivered to your inbox.
More from
Editors of EarthSky


