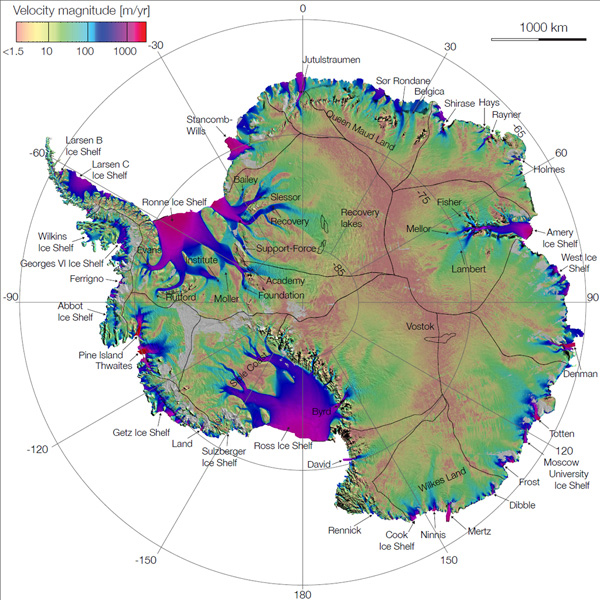
NASA-funded researchers used billions of data points captured by European, Japanese and Canadian satellites to create the first complete map of the speed and direction of ice flow in Antarctica. Eric Rignot of NASA’s Jet Propulsion Laboratory and the University of California at Irvine is lead author of a paper about the ice flow. The paper was published online on August 18, 2011 in Science Express. NASA says the information will help them predict sea level rise from global warming.
As the animation below shows, Antarctic ice flows outward – from the continent’s icy heart – toward the sea.
The map doesn’t show where ice is melting in Antartica, but it does show how ice is naturally being transported thousands of miles from the interior of the continent to Antarctica’s coastlines. The colors represent the speed of ice flows in meters per year, with areas in red and purple flowing the fastest.
Now here’s a still image of the map, which shows another level of detail.

The thick black lines delineate major ice divides. Subglacial lakes in Antarctica’s interior are also outlined in black. Thick black lines along the coast indicate ice sheet grounding lines.
Rignot and UC Irvine scientists Jeremie Mouginot and Bernd Scheuchl said they had to weed out cloud cover, solar glare and land features masking the glaciers in order to create this map of Antarctic ice flow. They painstakingly pieced together the shape and velocity of glacial formations, including those in previously uncharted East Antarctica, which comprises 77 percent of the continent. They said that – when they stood back and took in the full picture – they were surprised to discover a new ridge splitting the 5.4 million square mile (14 million square kilometer) Antarctic landmass from east to west.
The team also found unnamed formations moving up to 800 feet (244 meters) annually across immense plains sloping toward the Antarctic Ocean, in a different manner than past models of ice migration.
Thomas Wagner, NASA’s cryospheric program scientist in Washington, commented:
The map points out something fundamentally new: that ice moves by slipping along the ground it rests on. That’s critical knowledge for predicting future sea level rise. It means that if we lose ice at the coasts from the warming ocean, we open the tap to massive amounts of ice in the interior.
Bottom line: NASA-funded researchers using data from Japanese, European and Canadian satellites have released an animation showing the first complete map of the speed and direction of ice flow from the Antarctic continent. They say it will be useful in predicting future sea level rise.
March 2011 Japan tsunami broke off icebergs in Antarctica


