


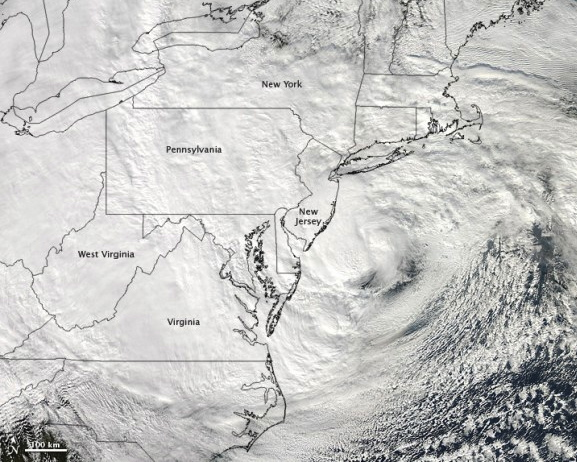
October 29, 2012 was a great and bad day for meteorology. Hurricane Sandy – unofficially known as Superstorm Sandy – was making landfall, affecting millions of people along the U.S. Mid-Atlantic and Northeast coasts. It was to be the deadliest and most destructive hurricane of the 2012 Atlantic hurricane season, as well as the second-costliest hurricane in United States history.
Sandy pushed ashore as a transitioning extratropical cyclone producing heavy rains, large storm surge, and even a winter storm in parts of West Virginia. The damage was extensive along the U.S. Northeast coastline and water from the Atlantic Ocean pushed ashore destroying buildings and bridges, and bringing saltwater into the subway stations of New York City.
Sandy killed nearly 110 people in the United States and an additional 72 people that lived in the Caribbean and Canada. The total death count is still uncertain as of today as some reports assert that the death toll is higher in the United States.
Sandy was responsible for nearly $65 billion (U.S) dollars in damage.
The tragedy for human life and property was in stark contrast to the success in forecasting Sandy, which could be considered as one of the finest moments in meteorology so far. Our weather models, which continue to evolve and become better, accurately predicted this storm well in advance which gave meteorologists plenty of time to warn the public about this devastating storm.
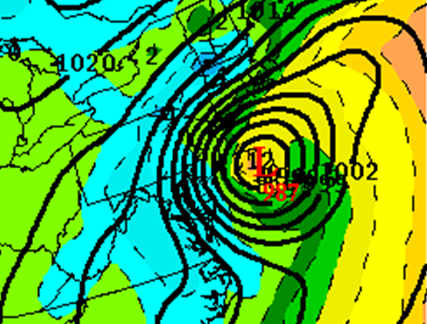
The European Centre for Medium-Range Weather Forecasts, also known as ECMWF or the European model, nailed down the track of Sandy a week before the storm pushed into southern New Jersey. The Europeans have more money invested into their weather model, and it uses 4D data assimilation unlike our American model, the Global Forecast System (GFS).
About five days before Sandy hit, the GFS model began to agree with the ECMWF. We put a lot of satellite data, measurements, and more into our model runs to produce more accurate forecasts. NOAA did a fantastic job and decided to launch upper air balloons all across the country at special hours to measure the atmosphere and to understand the large weather pattern and how it could affect Sandy in the long run.
In the case of Sandy, advancements in the field of meteorology gave us time to warn.
Yet, despite the advances in weather forecasting that provided over a week’s worth of time to prepare for this dangerous storm, when Hurricane Sandy hit the U.S. Northeast, the toll was high. One reason was that, as Sandy was striking the U.S. Northeast, it was beginning to interact with a cold front off the eastern U.S. coast. The interaction of the trough actually enhanced Sandy’s size and wind field.
Sandy ulimately was roughly estimated to be nearly 900 to 1,000 miles wide. Sandy tied the Great Long Island Express Hurricane of 1938 as the most powerful storm ever to hit the U.S. Northeast north of Cape Hatteras, North Carolina. Storm surge pushed across parts New York and New Jersey. Strong winds knocked trees over and millions of people lost power. In fact, 4.5 million out of 8.2 million people were without power in New Jersey and New York alone after Sandy came ashore.


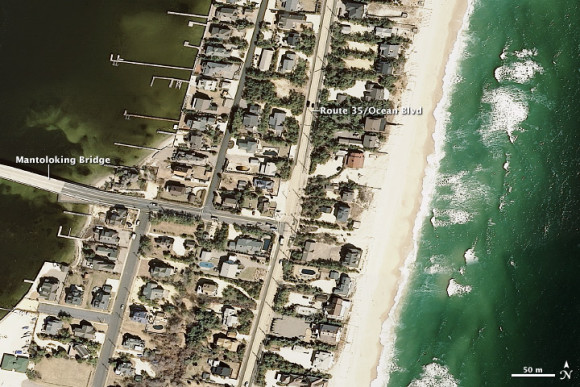
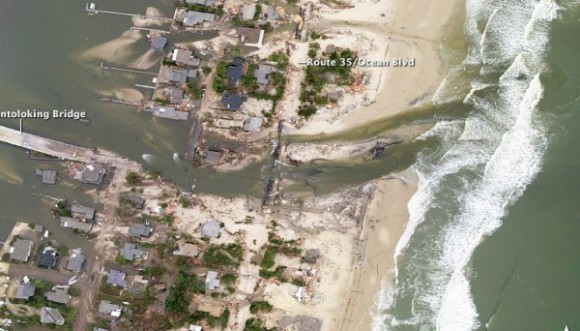
You can see how powerful the storm surge was along the Jersey shore as Sandy made landfall.
Before:
After:
Bottom line: Hurricane Sandy affected millions of lives and became the second-costliest storm to hit the United States with damage totals estimated around $65 billion dollars. Sandy killed nearly 200 people across the Caribbean, Canada, and the United States. The track of the storm is what made this weather story so unusual as it curved towards the U.S. Northeast as a trough of low pressure absorbed the system. While Sandy caused extreme damage along the U.S. coast and brought winter conditions across West Virginia, it also gave meteorologists better confidence that our skills in weather forecasting are getting better. We saw this storm a week before it hit and even formed. Just like every historical event, we will learn from our mistakes so that the next time another “Sandy” develops, we will be ready.
More links:
Who died during Hurricane Sandy and why?
The good, the bad, and the ugly of Hurricane Sandy
Pictures and video aftermath of Hurricane Sandy
Like what you read?
Subscribe and receive daily news delivered to your inbox.
More from
Matt Daniel


