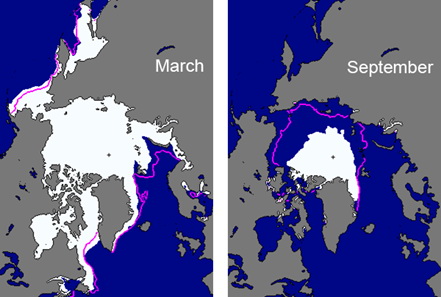
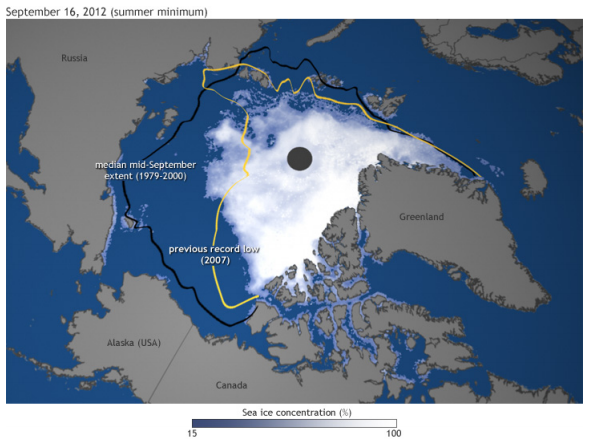
At the end of each year, the National Oceanic and Atmospheric Administration (NOAA) releases a report card on the state of the Arctic. In 2012, NOAA reports record low levels of sea ice extent, lower than we’ve seen before since the satellite era began in 1979. Plus, in June 2012, the Arctic experienced record low snow extent across the region. Greenland saw extreme melting during the summer of 2012, and the warmer temperatures and decreasing ice provided massive phytoplankton to grow. NOAA scientists said that air temperatures were on a par with the (relatively high) temperatures of the last decade, leading to, among other things, an increase in the length of the growing season along with tundra greenness in the Arctic. Climate models suggest that, in a warming climate, high latitudes such as the Arctic will be affected first, and so it seems to be. The 2012 Arctic Report Card is a peer-reviewed report that consists of 141 authors from 15 countries. If you ask a scientist who travels periodically to the Arctic or across Greenland, he or she will tell you that the landscape there is changing dramatically from year to year.
1) Snow cover duration was the second-shortest on record and new minima were set for snow cover extent in May over Eurasia and in June (when snow still covers most of the Arctic region) over the Northern Hemisphere.
2) The rate of loss of June snow cover extent between 1979 and 2012 (the period of satellite observation) set a new record of -17.6 percent per decade, relative to the 1979-2000 mean.
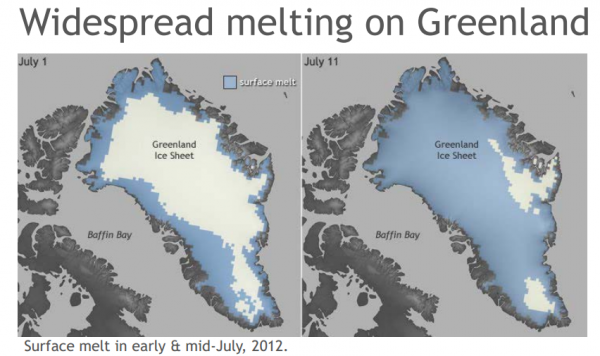
3) In Greenland, melting in some locations lasted up to approximately two months longer than the 1979-2011 average, with melting detected by satellite instruments over approximately 97 percent of the surface in July. The North Atlantic Oscillation (NAO) was negative for a large majority of summer 2012, and these values brought upon ridging across Greenland that influenced more ice melt across the region as temperatures increased. Greenland holds 680,000 cubic miles of ice, and if all of that ice were to melt completely, then the oceans would rise by more than 20 feet (6 meters). Of course, there are no projections of this happening in the near future. However, by 2100, ocean levels could rise by two to six feet (0.6 to 1.8 meters).
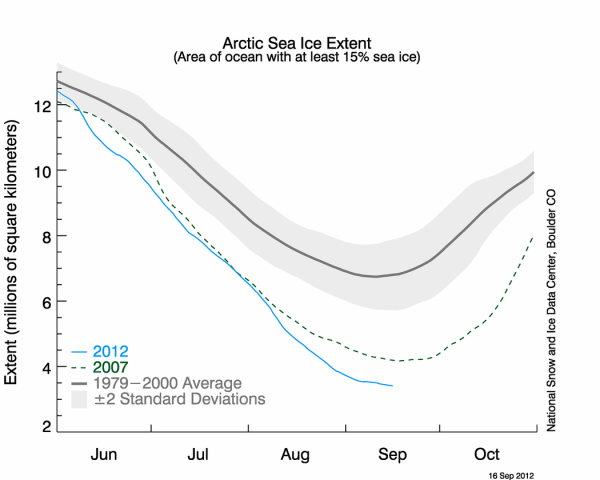
4) Sea ice extent in September 2012 reached the lowest observed in the satellite record (1979-present). This record was set despite a relatively high maximum sea-ice extent in March 2012, which was due to extensive ice in the Bering Sea. It broke the previous record set in 2007, which can be seen in the image above as the green, dashed line.
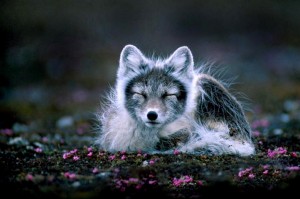
The report also mentioned parts of the ecosystem and wildlife that are being affected by the loss of sea ice extent across the region. Generally, the tundra is getting greener with more above ground growth. In fact, the growing season has increased over the past 10 years across the Arctic. Massive amounts of phytoplankton have grown in parts of the Arctic. Meanwhile, unique marine habitat containing abundant algal species in so-called “melt holes” was observed for the first time in perennial sea ice in the central Arctic Ocean. The changing environment is also taking a toll on the Arctic fox, which is nearing the brink of extinction in Fennoscandia. In the Arctic report, NOAA mentions that the current population of Arctic fox in Fennoscandia is estimated to be less than 200 individuals compared to over 15,000 in the mid-19th century. Meanwhile, in North America, the Arctic fox is abundant and the overall population probably ranges in the tens of thousands of individuals. An increase of the North American Red fox has been expanding northward in the same territories the Arctic fox are typically located. Due to the increase in Red foxes across the region, the Arctic fox is therefore influenced and pressured to move northward during the summer months. Red foxes are twice the size of Arctic foxes, and are dominate predators that take over dens and exclude Arctic foxes from parts of their breeding range.
Martin Jeffries is a co-editor of the 2012 Report Card and an Arctic science adviser to the Office of Naval Research. He is also a research professor at University of Alaska-Fairbanks. He said:
The record low spring snow extent and record low summer sea ice extent in 2012 exemplify a major source of the momentum for continuing change. As the sea ice and snow cover retreat, we’re losing bright, highly reflective surfaces, and increasing the area of darker surfaces—both land and ocean—exposed to sunlight. This increases the capacity to store heat within the Arctic system, which enables more melting—a self-reinforcing cycle.
Greenhouse gases continue to increase in the Arctic

As frozen ground melts, greenhouse gases such as carbon dioxide (CO2) and methane (CH4) increases as trapped gases escape into the atmosphere. Although carbon dioxide is known as the most common greenhouse gas linked with global warming, methane is actually a more powerful gas. Methane causes about 25 times more warming over 100 years than emission of an equal mass of carbon dioxide according to a study by Forster et al. 2007. According to the report, if permafrost thaws, then the carbon stored in the Arctic soils will decay and emitted into the atmosphere as a combination of greenhouse gases such as carbon dioxide and methane.
Bottom line: NOAA released its annual Arctic Report Card for 2012 that showed high rates of melting across the Arctic and throughout Greenland this year. For example, 2012 brought the lowest sea ice extent since record-keeping began in 1979. Snow cover duration was the second-shortest on record and new minima were set for snow cover extent in May over Eurasia and in June. Meanwhile, the tundra is getting greener as vegetation is increasing. The melting of the Arctic is also causing harm to the Arctic foxes that live in the region, which are now considered to be close to extinction in Fennoscandia (the Scandinavian Peninsula, Finland, Karelia and the Kola Peninsula). If you look at the long-term trend, it is obvious that we continue to see a decline in ice extent across the Arctic, as we have over the past 30 years. Will we continue to see record melt across the Arctic during the summer of 2013? Scientists are not sure, but the statistics do not lie. Melting is occurring, and it is playing a huge role to our ecosystem and global weather.


