


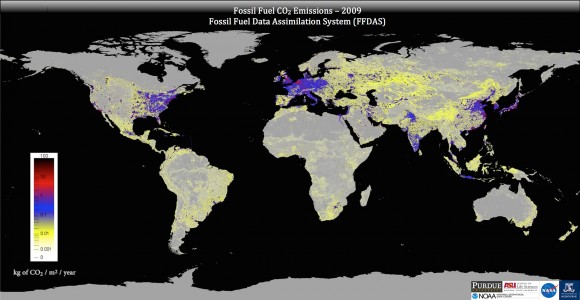
Researchers have developed a new system – which they call the Fossil Fuel Data Assimilation System (FFDAS) – to estimate CO2 emissions from burning fossil fuels. This new system has now been used to quantify 15 years of CO2 emissions, every hour, for the entire planet – down to the city scale.
Researchers unveiled the new system in an article published September 10 in the Journal of Geophysical Research.
The FFDAS uses information from satellite feeds, national fuel accounts and a new global database on power plants to create high-resolution planetary maps. These maps provide a scientific, independent assessment of the planet’s greenhouse gas emissions – something policymakers can use and the public can understand.
The research team combined information from space-based “nighttime lights,” a new population database, national statistics on fuel use, and a global database on power plants to create a CO2 emissions map broken down by hour, year and region.
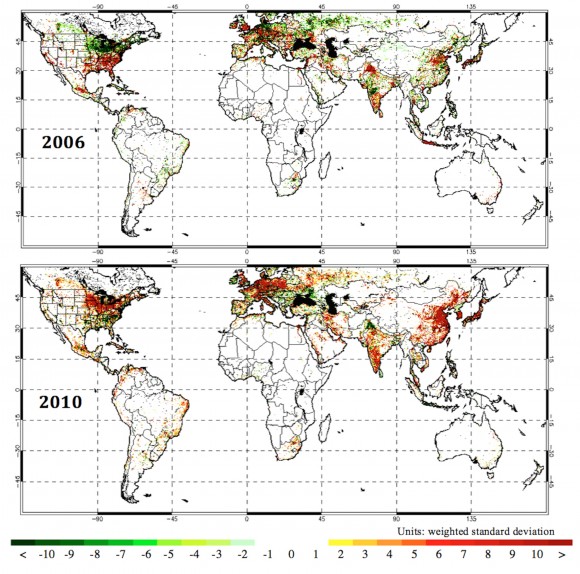
The FFDAS showed surprising detail on global emissions before and after the Global Financial Crisis, with portions of the U.S., Europe and India recovering sooner and more dramatically. The multiyear results also showed the dramatic rise of CO2 emissions in China and South Asia.
According to Peter Rayner, lead investigator from the University of Melbourne, Australia:
It used to take years to assemble all the statistics on CO2 emissions. With this system, once the satellite data is flowing, we can update our emissions maps each year. It gives a quick check on efforts to limit climate change.
Bottom line: A new system, called the Fossil Fuel Data Assimilation System has been used to quantify 15 years of CO2 emissions, every hour, for the entire planet – down to the city scale.
Like what you read?
Subscribe and receive daily news delivered to your inbox.
More from
Eleanor Imster


