The European Space Agency (ESA) released the video above on October 18, 2019. It shows the evolution throughout 2019 of two large cracks in Pine Island Glacier in Antarctica. If you watch, you’ll see that the sizes of Paris and New York’s Manhattan Island are also shown, to help you see the scale of the glacier’s cracks. Since early 2019, the two large rifts each have rapidly grown to approximately 12 miles (20 km) in length.
ESA created the video using satellite data from the Copernicus Sentinel-1 mission, which carries radar, and which therefore can return images from Antarctica year-round, even during the long months of continuous winter darkness.
Pine Island Glacier is one of many Antarctic ice streams, but it’s of special interest to scientists in part because observations have shown it to be changing rapidly. It’s one of the primary ice arteries in the West Antarctic Ice Sheet, yet it’s known to be thinning, accelerating in its already-fast flow, and also receding back landward from the Amundsen Sea, which is part of the Southern Ocean encircling the Antarctic continent. All of these characteristics of Pine Island Glacier contribute directly to sea level rise.
EarthSky 2020 lunar calendars are available! They make great gifts. Order now. Going fast!
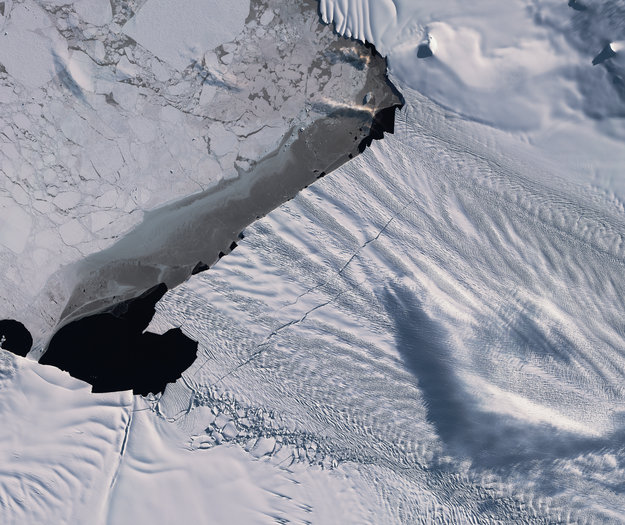
Pine Island Glacier is also buttressed by a large, floating ice shelf, which is itself thinning and which calved a huge iceberg in late 2018. That iceberg was labeled B46 by scientists. It was approximately 87 square miles (226 sq km) in size. In early 2019, not long after B46 left the ice sheet, scientists spotted the additional large rifts in the glacier, shown in the video at the top of this page and in the satellite image above.
Mark Drinkwater leads the Earth and Mission Sciences Division at ESA. He said in a statement:
These new rifts appeared very soon after last year’s major calving of iceberg B46. Sentinel-1 winter monitoring of their progressive extension signals that a new iceberg of similar proportions will soon be calved.
View Pine Island Glacier on an interactive Google map

The Pine Island Glacier ice shelf now has one of the fastest rates of ice-shelf thinning in Antarctica. ESA said on October 19, 2019, that – since the early 1990s – its ice velocity (the rate of ice flow toward the ocean surrounding Antarctica) has increased dramatically to values which exceed 30 feet (10 meters) a day.
As our earthly satellites have looked on, since the 1990s, calving events have occurred in 1992, 1995, 2001, 2007, 2011, 2013, 2015, 2017 and 2018.
3/ Here is a zoom of the animation. The cracks are about 20 kilometers long, and up to 300 meters wide. pic.twitter.com/oqCY0DVL6X
— Erwan Rivault (@ErwanRivault) October 19, 2019
ESA said that its ERS-1, ERS-2, Envisat and Copernicus Sentinel-1 satellites have previously provided images with which to monitor changes in these glaciers, and explained:
With routine, year-round Copernicus Sentinel-1 images, it is possible to track changes in the speed of the ice flow, to monitor the migration of the grounding line, and the development of fractures and rifts which ultimately lead to iceberg calving events …
Recently, the frequency of Pine Island Glacier calving events has increased. Today, the glacier is observed to be losing mass by a combination of calving events together with strong basal melting, where warm ocean currents erode the underside of the floating ice shelf. As the ice shelf both thins and calves enormous icebergs, the glacier discharge is unable to replenish the ice lost and the ice shelf front recedes from its previous position.
Mark Drinkwater added:
Long-term measurements of West Antarctic Ice Sheet glaciers such as Pine Island are critical to understanding changes to the rate of loss of ice mass into the ocean.
The animation below comes from NASA research, and was released in 2011. It’s the first complete map showing the speed and direction of ice flow in Antarctica. The map – created using integrated radar observations from a consortium of international satellites – shows glaciers flowing thousands of miles from Antarctica’s deep interior to its coast. The NASA team that created it also used the word “critical,” saying this knowledge will be:
… critical for tracking future sea-level increases from climate change.
Bottom line: ESA scientists said in October 2019 that the two new cracks in Pine Island Glacier – observed since early this year – are getting longer. They’re now about 12 miles (20 km) in length.
Like what you read?
Subscribe and receive daily news delivered to your inbox.
More from
Deborah Byrd