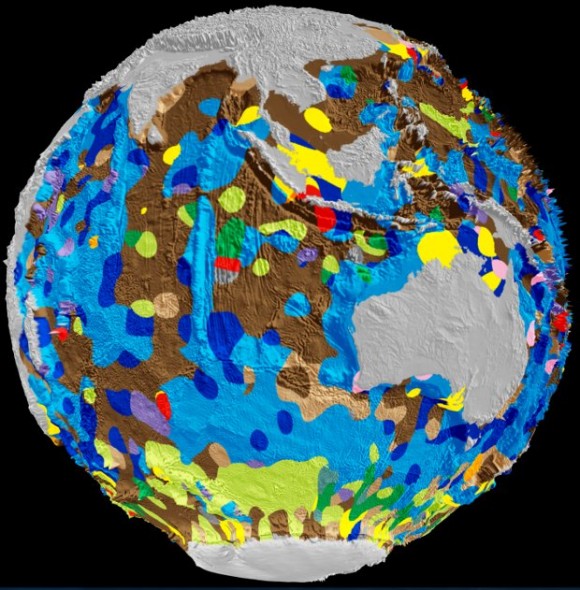
Scientists have created a digital map of the global seafloor’s geology. It’s the first time the composition of our planet’s seafloor has been mapped in 40 years; the most recent map was hand drawn in the 1970s.
Published in the latest edition of Geology, the map will help scientists better understand how our oceans have responded, and will respond, to environmental change. It also reveals the deep ocean basins to be much more complex than previously thought. Adriana Dutkiewicz from the University of Sydney is the lead researcher. She said:
In order to understand environmental change in the oceans we need to better understand what is preserved in the geological record in the seabed.
The deep ocean floor is a graveyard with much of it made up of the remains of microscopic sea creatures called phytoplankton, which thrive in sunlit surface waters. The composition of these remains can help decipher how oceans have responded in the past to climate change.
A special group of phytoplankton called diatoms produce about a quarter of the oxygen we breathe and make a bigger contribution to fighting global warming than most plants on land. Their dead remains sink to the bottom of the ocean, locking away their carbon.
The new seafloor geology map demonstrates that diatom accumulations on the seafloor are nearly entirely independent of diatom blooms in surface waters in the Southern Ocean. Professor Dietmar Muller from the University of Sydney, is a study co-author. Muller said:
This disconnect demonstrates that we understand the carbon source, but not the sink.
Some of the most significant changes to the seafloor map are in the oceans surrounding Australia. Dutkiewicz said:
The old map suggests much of the Southern Ocean around Australia is mainly covered by clay blown off the continent, whereas our map shows this area is actually a complex patchwork of microfossil remains. Life in the Southern Ocean is much richer than previously thought.
The scientists analyzed and categorized around 15,000 seafloor samples – taken over half a century on research cruise ships to generate the data for the map. They teamed with the National ICT Australia (NICTA) big data experts to find the best way to use algorithms to turn this multitude of point observations into a continuous digital map. Simon O’Callaghan from NICTA is a study co-author. He said:
Recent images of Pluto’s icy plains are spectacular, but the process of unveiling the hidden geological secrets of the abyssal plains of our own planet was equally full of surprises!
Enjoying EarthSky? Sign up for our free daily newsletter today!
Bottom line: Scientists have created a new digital map of the geology of Earth’s seafloor.
Like what you read?
Subscribe and receive daily news delivered to your inbox.
More from
Editors of EarthSky