NASA originally posted this article on March 7, 2023. Edits by EarthSky.
A NASA Earth-observing satellite has helped researchers track carbon dioxide emissions for more than 100 countries around the world. The pilot project offers a powerful new look at the carbon dioxide being emitted in these countries and how much of it is removed from the atmosphere by forests and other carbon-absorbing “sinks” within their borders. The findings demonstrate how space-based tools can support insights on Earth as nations work to achieve climate goals.
The international study, conducted by more than 60 researchers, used measurements made by NASA’s Orbiting Carbon Observatory-2 (OCO-2) mission, as well as a network of surface-based observations, to quantify increases and decreases in atmospheric carbon dioxide concentrations from 2015 to 2020. Using this measurement-based (or “top-down”) approach, the researchers were then able to infer the balance of how much carbon dioxide was emitted and removed.
Although the OCO-2 mission was not specifically designed to estimate emissions from individual nations, the findings from the 100-plus countries come at an opportune time. The first Global Stocktake – a process to assess the world’s collective progress toward limiting global warming, as specified in the 2015 Paris Agreement – takes place in 2023.
Last chance to get a moon phase calendar! Only a few left. On sale now.
Developing a database of emissions
Karen St. Germain, director of NASA’s Earth Science Division at NASA Headquarters in Washington, said:
NASA is focused on delivering Earth science data that addresses real world climate challenges, like helping governments around the world measure the impact of their carbon mitigation efforts. This is one example of how NASA is developing and enhancing efforts to measure carbon emissions in a way that meets user needs.
Traditional activity-based (or “bottom-up”) approaches to carbon measurement rely on tallying and estimating how much carbon dioxide is being emitted across all sectors of an economy, such as transportation and agriculture. Bottom-up carbon inventories are critical for assessing progress toward emission-reduction efforts, but compiling them requires considerable resources, expertise, and knowledge of the extent of the relevant activities.
This is why developing a database of emissions and removals via a top-down approach could be especially helpful for nations that lack traditional resources for inventory development, the study authors assert. In fact, the scientists’ findings include data for more than 50 countries that have not reported emissions for at least the past 10 years.
Tracking fluctuations in carbon dioxide emissions
The study provides a new perspective by tracking both fossil fuel emissions and the total carbon “stock” changes in ecosystems, including trees, shrubs, and soils. The data is particularly useful for tracking carbon dioxide fluctuations related to land cover change. Emissions from deforestation alone make up a disproportionate amount of total carbon output in the Global South, which encompasses regions of Latin America, Asia, Africa, and Oceania. In other parts of the world, the findings indicate some reductions in atmospheric carbon concentrations via improved land stewardship and reforestation.
The authors said that bottom-up methods for estimating carbon dioxide emissions and removals from ecosystems are essential. However, those methods are vulnerable to uncertainty when data is lacking or the net effects of specific activities, such as logging, aren’t fully known.
Philippe Ciais, a study author and research director at the Laboratoire des Sciences du Climat et de l’Environnement in France, said:
Our top-down estimates provide an independent estimate of these emissions and removals, so although they cannot replace the detailed process understanding of traditional bottom-up methods, we can check both approaches for consistency.
Carbon dioxide emissions vs. storage
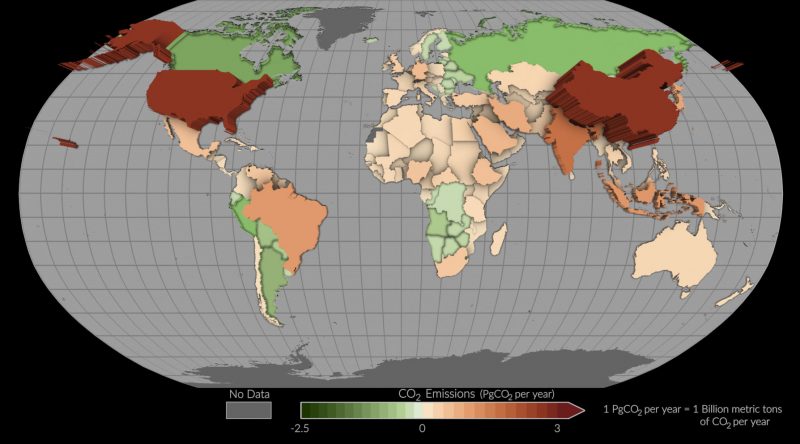
The animation below from NASA’s Scientific Visualization Studio shows yearly fossil fuel emissions by more than 100 countries from 2015 to 2020. Countries with high emissions, including the U.S. and China (seen here in dark red), appear to pop from the page, compared to those with lower emissions.
The map below illustrates changes in the amount of carbon stored in organic matter on land, called terrestrial carbon stock changes, from 2015 to 2020. Activities such as improved land stewardship and deforestation, which is more extensive in the tropics than other regions, affect these stock changes.
National inventories
The study offers a complex picture of carbon moving through Earth’s land, ocean, and atmosphere.
In addition to direct human impacts accounted for by national inventories, unmanaged ecosystems like some tropical and boreal forests – where humans have a minimal footprint – can sequester carbon from the atmosphere, thus reducing potential global warming.
Study author Noel Cressie, a professor at the University of Wollongong in Australia, said:
National inventories are intended to track how management policies impact emissions and removals of CO2. However, the atmosphere doesn’t care whether CO2 is being emitted from deforestation in the Amazon or wildfires in the Canadian Arctic. Both processes will increase the concentration of atmospheric CO2 and drive climate change. Therefore, it is critical to monitor the carbon balance of unmanaged ecosystems and identify any changes in carbon uptake.
Looking toward the future
Looking forward, the researchers said their pilot project can be further refined to understand how emissions from individual nations are changing.
Lead author Brendan Byrne, a scientist at NASA’s Jet Propulsion Laboratory in Southern California, said:
Sustained, high-quality observations are critical for these top-down estimates. Continued observations from OCO-2 and surface sites will allow us to track how these emissions and removals change as the Paris Agreement is implemented. Future international missions that provide expanded mapping of CO2 concentrations across the globe will allow us to refine these top-down estimates and give more precise estimates of countries’ emissions and removals.
Launched in 2014, the OCO-2 satellite maps natural and human-made carbon dioxide concentrations with the help of three camera-like spectrometers. These devices can detect the unique spectra, or light signature, of carbon dioxide. They measure the gas indirectly by how much reflected sunlight it absorbs in a given column of air.
Bottom line: A new study breaks down carbon dioxide emissions by country, revealing a map of which nations contribute the most of the greenhouse-warming gas and which countries provide a carbon sink.
Read more: Why carbon dioxide has such outsized influence on Earth’s climate
Like what you read?
Subscribe and receive daily news delivered to your inbox.
More from
EarthSky Voices