Solar Cycle 25 officially began in September 2020, and we’re now seeing more spots on the sun. Soumyadeep Mukherjee in Kolkata, West Bengal, India wrote:
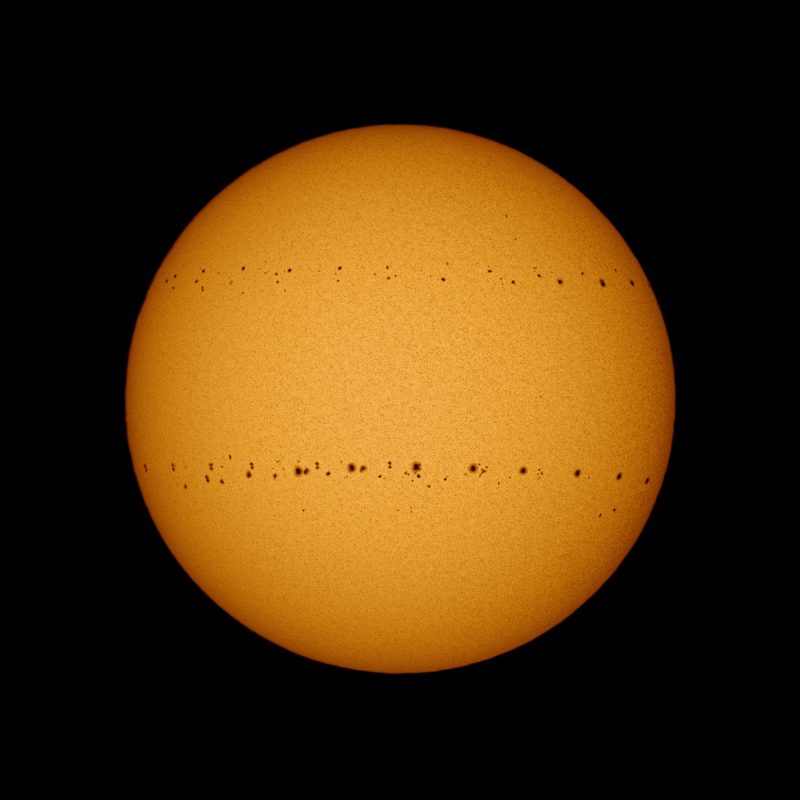
I imaged the sun for 100 days in a row, from December 25, 2020, to April 3, 2021. This image is a blend of a total of 100 images showing every sunspot that has appeared on the solar disk over these 100 days. There were a total of 19 active regions, from AR12794 to AR12812. The sunspot activity is clustered in two narrow bands, approximately 25 degrees north and south of the sun’s equator. As the solar activity increases in the coming days, we are hoping to see more sunspot regions appearing on the solar disk.
Thank you, Soumyadeep!
Did you know the location of sunspots migrates in a systematic way as the solar cycle waxes and wanes from minimum to maximum and back again? The UCAR Center for Science Education explained:
Along with the number of sunspots, the location of sunspots varies throughout the sunspot cycle. At solar minimum, sunspots tend to form around latitudes of 30 to 45 degrees north and south of the sun’s equator. As the solar cycle progresses through solar maximum, sunspots tend to appear closer to the equator, around a latitude of 15 degrees. Towards the end of a cycle, with solar min once again approaching, sunspots form quite close to the solar equator, around 7 degrees north and south latitude. There is often an overlap in this latitudinal migration trend around solar minimum, when sunspots of the outgoing cycle are forming at low latitudes and sunspots of the upcoming cycle begin to form at high latitudes once again.
This gradual equatorward drift of sunspots throughout the sunspot cycle, which was first noticed in the early 1860s by the German astronomer Gustav Spörer and the Englishman Richard Christopher Carrington, is often called Spörer’s Law.
In 1904 another English astronomer, Edward Walter Maunder, constructed the first butterfly diagram, a graphical plot of this sunspot migration trend.
Bottom line: A composite image showing 100 days of sunspots, as Solar Cycle 25 ramps up and the sun begins to rise in activity. Also, an explanation of the migration of sunspots throughout a solar cycle.
Like what you read?
Subscribe and receive daily news delivered to your inbox.
More from
Deborah Byrd