


In early 2020, both satellite and ground-based observations showed significant reduction in some air pollutants coinciding with nationwide lockdowns put in place in various parts of the world to slow the spread of Covid-19. One year later, as lockdown restrictions loosen in some countries and regular activity resumes, satellite data suggests pollutant levels are bouncing back to pre-Covid levels, according to a March 15, 2021, report from ESA.
On January 23, 2020, in an effort to stop Covid’s spread, the world’s first coronavirus lockdown come into force in Wuhan, China. This lockdown set the precedent for similar measures in other cities across the country. Factories and other industries were shut down, people were confined to their homes, traffic slowed to a halt. In the following weeks and months, similar measures were put in place worldwide.
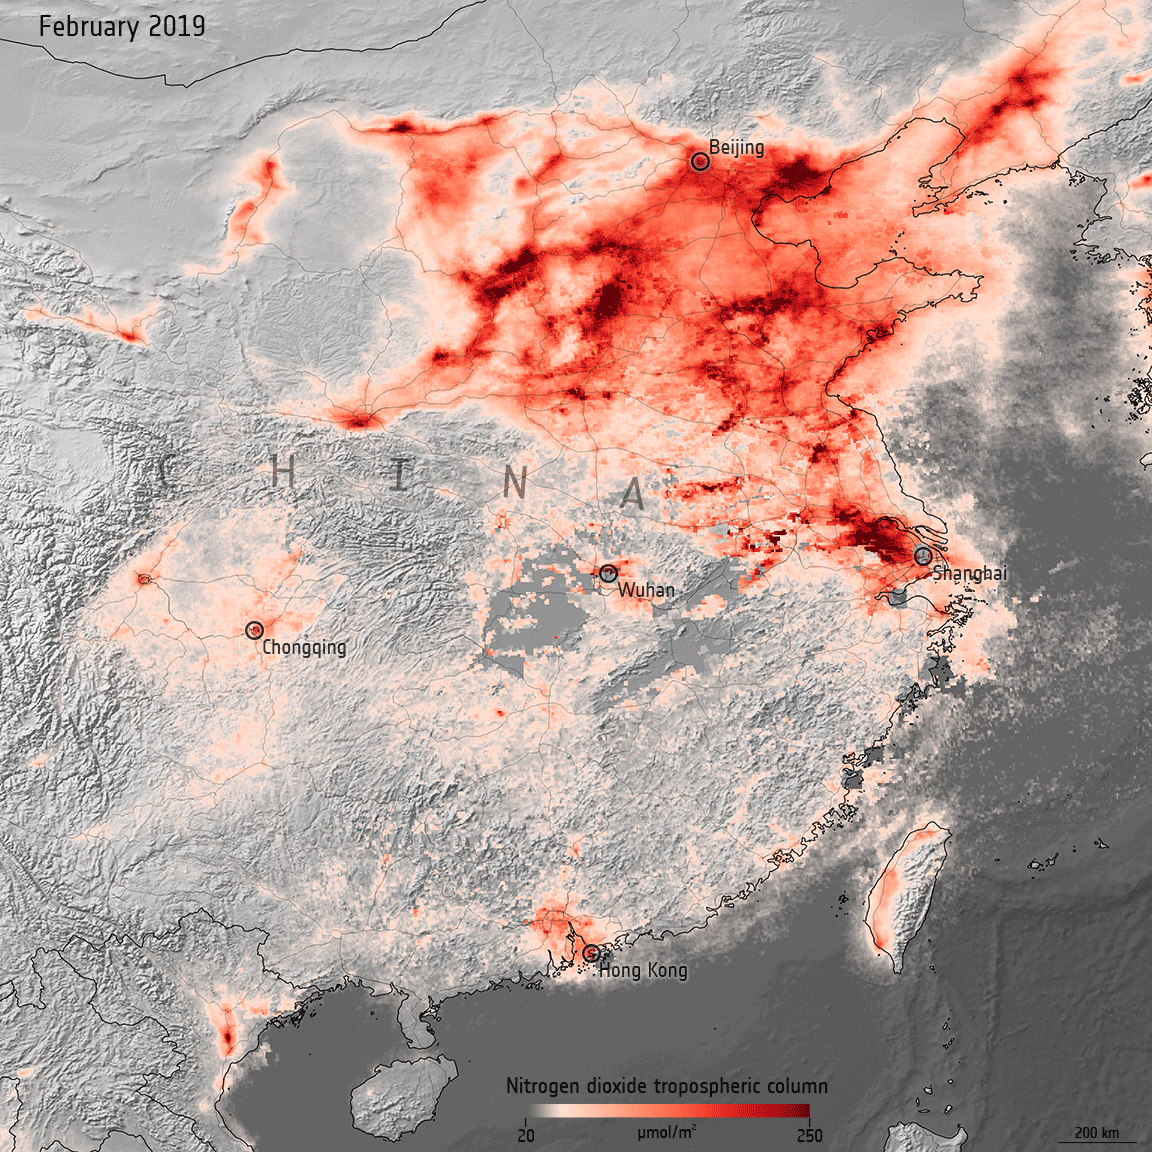
During the restrictions, with human activity slowed way down, a significant reduction in air pollutants across China was detected by satellites. This included reduced emissions of nitrogen dioxide, a pollutant released by power plants, traffic, and the combustion of fossil fuel in industrial processes.
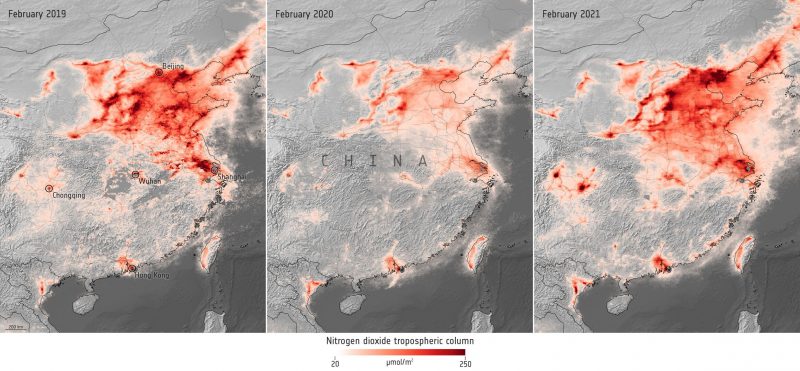
Now, more than one year later, as restrictions have eased, the average level of air pollutants over China has rebounded and is on the rise again. ESA scientists said they also expect to see similar rebounds in air pollutants over Europe and across the globe in the coming weeks and months as Covid lockdowns are lifted. According to the ESA report:
The data indicate that nitrogen dioxide concentrations in Beijing dropped by around 35% between February 2019 and 2020, before returning to similar levels in February 2021. Similarly, in Chongqing, nitrogen dioxide dropped by approximately 45% between February 2019 and February 2020, before returning to almost double pre-COVID numbers.
ESA’s Claus Zehner is Copernicus Sentinel-5P mission manager. He said in a statement:
We expected air pollution to rebound as lockdowns are lifted across the globe. Nitrogen dioxide concentrations in our atmosphere do not depend on human activity alone. Weather conditions such as wind speed and cloud cover also affect those levels; however, a large quantity of these reductions are due to restrictions being eased. In the coming weeks and months, we expect increases of nitrogen dioxide concentrations also over Europe.
Bottom line: In early 2020, satellite data showed a decline in air pollution coinciding with nationwide lockdowns put in place in various countries around the world to stop the spread of Covid-19. One year later, in March 2021, as lockdown restrictions loosen in some countries and regular activity resumes, air pollution is bouncing back to pre-Covid levels.
Like what you read?
Subscribe and receive daily news delivered to your inbox.
More from
Eleanor Imster


