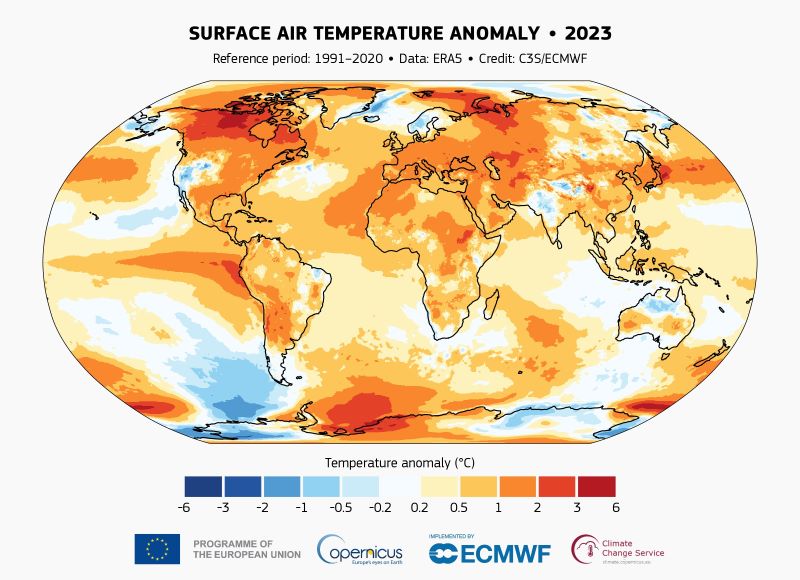
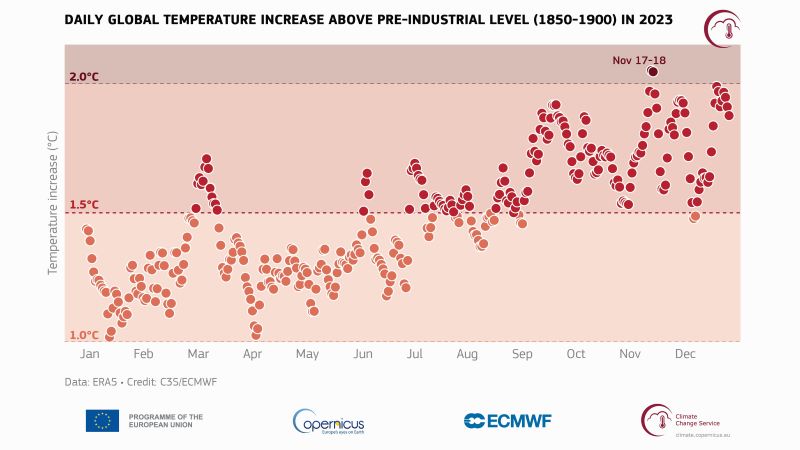
“Global temperatures reached exceptionally high levels in 2023,” said a new report out on January 9, 2024. The data are from Copernicus, the European Union space program’s Earth-observing program. We overtook the previous hottest year on record, 2016, by a large margin. We also had daily global temperature averages that surpassed pre-industrial levels by more than 2 degrees Celsius [3.6°F] for the first time. And, in 2023, Earth had its hottest month on record. What drove the unprecedented heat? A combination of greenhouse gasses, El Niño and other natural variations.
The 2024 lunar calendars are here! Best New Year’s gifts in the universe! Check ’em out here.
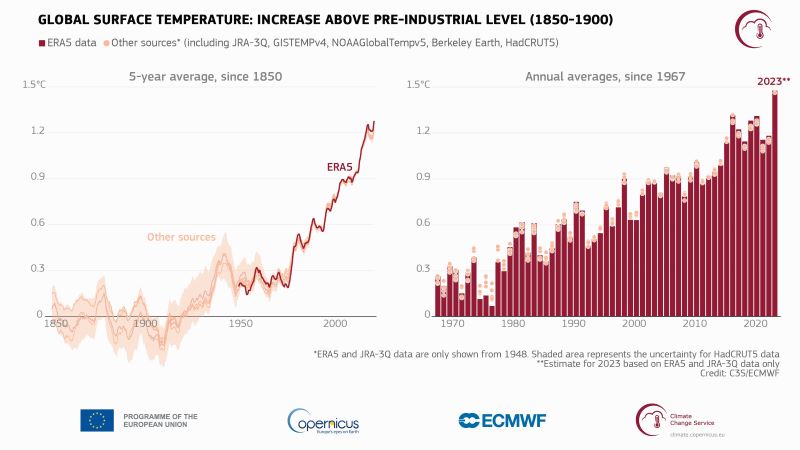
2023 was the hottest year on record
2023 was the hottest year on record, with data going back to 1850. Last year was the first time that every day within the year exceeded 1 C above the 1850-1900 pre-industrial level. And November 17 and 18 were the first time the average global temperature exceeded 2 C above pre-industrial temps.
Why do we compare temperatures now to the pre-industrial level? This is the level discussed in the Paris Agreement. In the Paris Agreement, 196 parties agreed to limit temperature increases to well below 2 C above pre-industrial levels and to aim for 1.5 C. So why is 2 C the magic number? As Maria Ivanova at Northeastern University explained:
At two degrees we see dramatic alterations to the ability of the Earth’s system to maintain the conditions that allow for human life and indeed other species’ life.
Taking our temperature
The average global temperature in 2023 was 14.98 C, or 58.96 F. That’s 0.17 C (0.306 F) higher than 2016. June 2023 is when Earth really started running a fever. In fact, each month from June to December was warmer than the corresponding month in any previous year. Additionally, July and August 2023 were the warmest two months on record.
Why the uptick from June onward? La Niña officially came to an end in spring. Then El Niño conditions developed. As Climate.gov said:
The atmosphere warms more during El Niño and less during La Niña, and that affects global average temperature.
We just had a rare three-year La Niña event. The World Meteorological Organizational officially declared the onset of El Niño in early July. And history shows that the warmest years in any decade are usually El Niño years and the coldest years are usually La Niña years. However, as the report said:
The transition to El Niño alone does not explain all of the increase in ocean surface temperatures at a global scale in 2023.
Other remarkable records
The report also highlighted record-low Antarctic sea ice extent, with low levels also in the Arctic. Carbon dioxide in the atmosphere hit 419 parts per million. Plus, estimated global wildfire carbon emissions in 2023 increased 30% compared to 2022, largely due to Canadian wildfires.
Samantha Burgess of C3S said:
2023 was an exceptional year with climate records tumbling like dominoes … Temperatures during 2023 likely exceed those of any period in at least the last 100,000 years.
And Carlo Buontempo of C3S added:
The extremes we have observed over the last few months provide a dramatic testimony of how far we now are from the climate in which our civilization developed. This has profound consequences for the Paris Agreement and all human endeavors. If we want to successfully manage our climate risk portfolio, we need to urgently decarbonize our economy whilst using climate data and knowledge to prepare for the future.
Bottom line: A combination of greenhouse gases, El Niño and other natural variations made 2023 the hottest year on record.
Like what you read?
Subscribe and receive daily news delivered to your inbox.
More from
Kelly Kizer Whitt