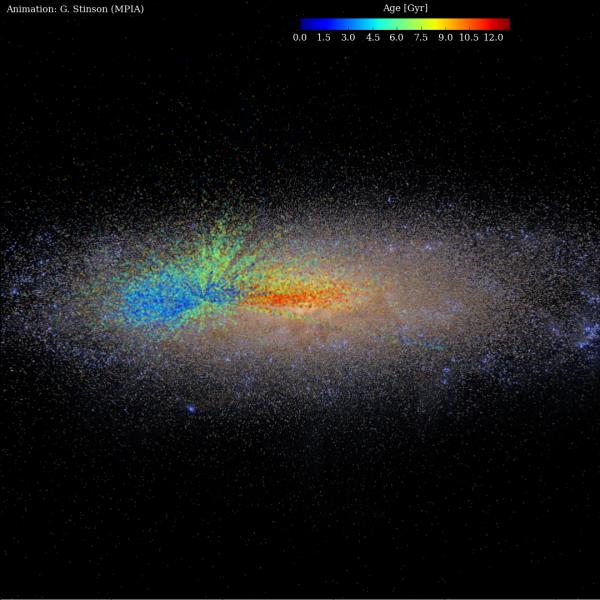
Scientists have completed the first-ever comprehensive age map of our home galaxy, the Milky Way. They learned that older Milky Way stars tend to lie near the center of the galaxy, while subsequent generations formed further out. Melissa Ness of the Max Planck Institute for Astronomy in Heidelberg, Germany, who led the research, commented:
Our galaxy grew up by growing out.
Her team presented these results late last week (January 8, 2016) at the American Astronomical Society meeting in Kissimmee, Florida. They measured the composition and masses of red giant stars – bright stars in the final stages of their lives – to learn their ages. The new Milky Way age map uses the ages of more than 70,000 stars and extends halfway across our galaxy to a distance 50,000 light-years away.
Marie Martig of Swinburne University of Technology in Melbourne, Australia was lead author of a study that was combined with this study to reveal stars’ ages. She said:
If we know the mass of a red giant star, we know its age by using the fusion clock inside every star.
In other words, there’s a known relationship between age and mass in these stars.
Finding the masses of giant stars has historically been very difficult, however, and that’s why the astronomers combined ground-based and space-based observations to pin down the red giant masses, and, subsequently, their ages.
The team started with spectra – the rainbow array of colors in starlight – taken via sub-survey of the Sloan Digital Sky Survey, called the Apache Point Observatory Galaxy Evolution Experiment (APOGEE). A star’s spectrum reveals its composition, and, in this case, it was possible to obtain many spectra simultaneously. Steve Majewski, principal investigator of the APOGEE survey, explained:
APOGEE … can get high-quality spectra for 300 stars simultaneously over a large area of sky. Seeing so many stars at once means getting spectra of 70,000 red giants is actually possible with a single telescope in a few years’ time.
The team turned to the Kepler planet-hunter spacecraft to provide the missing link between APOGEE spectra and stellar ages. Kepler has discovered about half of the more than 2,000 known exoplanets,or planets orbiting distant suns. But it has also acquired additional basic data on many thousands of stars since the space observatory’s launch in March, 2009.
APOGEE had chosen to look at thousands of red giants that had also been seen by Kepler. Writing at Space.com, Nola Taylor Redd explained how they combined the two sorts of observations:
In an independent study, Marie Martig … looked at 2,000 stars whose masses and ages had been previously determined by Kepler. By comparing those values to the measurements of the stars’ carbon and nitrogen obtained by APOGEE, she was able to calculate the relationship among red giants’ mass, age and carbon and nitrogen abundances.
Ness and her team, which included Martig, then used that relationship to determine the mass of the 70,000 red giant stars APOGEE had studied in the disk of the Milky Way.
Because the relationship between age and mass in these stars is known, the researchers were thus able to measure ages for all 70,000 red giant stars in the APOGEE study … and to produce their age map.
Bottom line: Astronomers have determined masses and ages for 70,000 red giant stars, out to 50,000 light-years, a distance halfway across our Milky Way galaxy. They used this information to produce a first-ever comprehensive age map of the galaxy. The map showed that older Milky Way stars tend to lie near the center of the galaxy, while subsequent generations formed further out.
Like what you read?
Subscribe and receive daily news delivered to your inbox.
More from
Deborah Byrd