


The Sloan Digital Sky Survey III (SDSS-III) has released new data in the form of the largest three-dimensional map of our universe so far. It’s a map of 1.2 million galaxies over a quarter of the sky and over a volume of space of 650 cubic billion light-years. Hundreds of scientists worked together for 10 years to create this map of the cosmic web of galaxies and to use its data to make one of the most precise measurements yet of dark energy, the mysterious force causing an accelerating expansion of our universe. A collection of papers describing these results was submitted this week (July 14, 2016) to the Monthly Notices of the Royal Astronomical Society.
Jose Vazquez of Brookhaven National Laboratory, a scientist involved with the work, whose role was to search for evidence of unexplained physical phenomena in the results, said he didn’t find any. He commented in a statement from SDSS-III:
Our latest results tie into a clean cosmological picture, giving strength to the standard cosmological model that has emerged over the last 18 years.
In other words, current theories of cosmologists – who give us our picture of the universe on the largest possible scales – are alive and well.
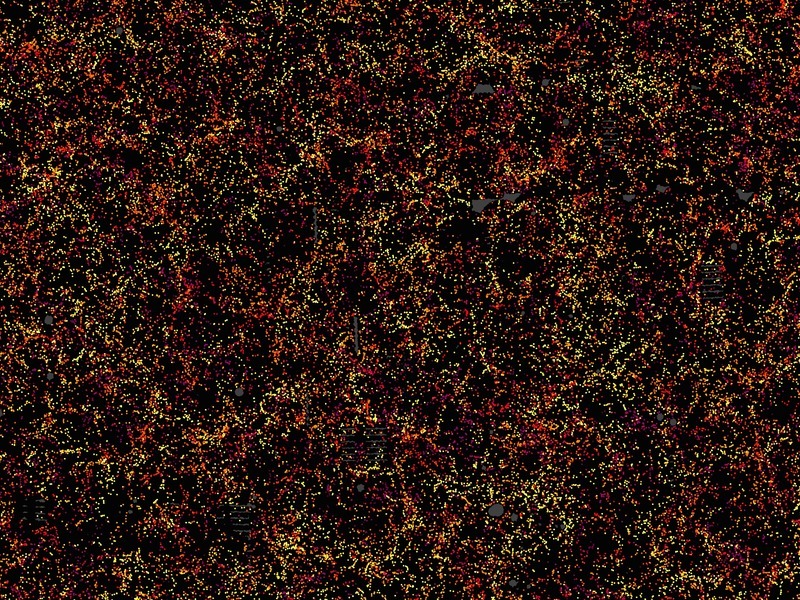
Before we go on, look at the image above, and take a moment to think about the universe as a whole, as modern theories describe it. Each dot in the picture at top indicates the position of a galaxy. The image covers about 1/20th of the sky, a slice of the universe 6 billion light-years wide (thus we see some of these galaxies 6 billion years into the past), 4.5 billion light-years high, and 500 million light-years thick.
Color indicates distance from Earth, ranging from yellow on the near side of the slice to purple on the far side.
Note that the dots – the galaxies – are highly clustered. Delicate clustering such as this is a key feature of modern cosmological theories, which describe the universe as a vast cosmic web, whose filaments contain huge galaxy superclusters, with voids in between. Modern cosmologists believe this entire structure, the structure of our universe as a whole, was seeded in the first fraction of a second after the Big Bang.

Taken as a whole, the new map helps to reveal the vast scale of our universe, which is thought to contain more than one 100 billion galaxies. How do modern cosmologists study such a vast universe?
Here’s one way. Measurements providing data about the galaxies in the new map were carried out by the Baryon Oscillation Spectroscopic Survey (BOSS) program of SDSS-III. This program maps the distribution of galaxies by detecting the imprint of baryon acoustic oscillations in the early universe. The BOSS website explains:
Sound waves that propagate in the early universe, like spreading ripples in a pond, imprint a characteristic scale on cosmic microwave background fluctuations. These fluctuations have evolved into today’s walls and voids of galaxies, meaning this baryon acoustic oscillation (BAO) scale … is visible among galaxies today.
The SDSS-III statement explained how these observations were used in the analysis of data from the new map:
Shaped by a continuous tug-of-war between dark matter and dark energy, the map revealed by BOSS allows astronomers to measure the expansion rate of the universe and thus determine the amount of dark matter and dark energy …

Jeremy Tinker of New York University, a co-leader of the scientific team, said:
This map has allowed us to make the best measurements yet of the effects of dark energy in the expansion of the universe. We are making our results and map available to the world.
Rita Tojeiro of the University of St. Andrews is the other co-leader of the BOSS galaxy clustering working group along with Tinker. She commented:
If we were to scale the volume of our survey to a cube 1 mile on each side, then the visible part of an individual galaxy would be about 1 millimeter across. Our challenge in the analysis of this map was equivalent to measuring the distances between all the pairs of galaxies separated by 100 yards throughout a cubic mile of space!
How galaxies evolve in the cosmic web.
Three scientists answer your questions about dark matter.
Bottom line: Hundreds of astronomers around the world, affiliated with the Sloan Digital Sky Survey III, compiled a new map of the universe based on observations and measurements of 1.2 million galaxies over a quarter of the sky. The observations match well with modern cosmological theories.
Via the Max Planck Institute for Astrophysics and SDSS-III.
Like what you read?
Subscribe and receive daily news delivered to your inbox.
More from
Deborah Byrd


