As we continue to progress into the summer months, we begin to monitor and watch ice melting across the Arctic. More sunlight and warmer conditions help melt Arctic ice each year from about May through early September. Then, around October each year, sea ice extent begins to grow again as the winter months approach. In 2012, sea ice maximum occurred on March 20, and afterwards Arctic sea ice underwent a loss of 11.83 million square kilometers (4.57 million square miles), the largest Arctic summer ice loss since satellites began monitoring sea ice continuously in 1979. In June 2013, ice extent across the Arctic was below average once again, although nowhere close to the record ice loss seen last year at this time.
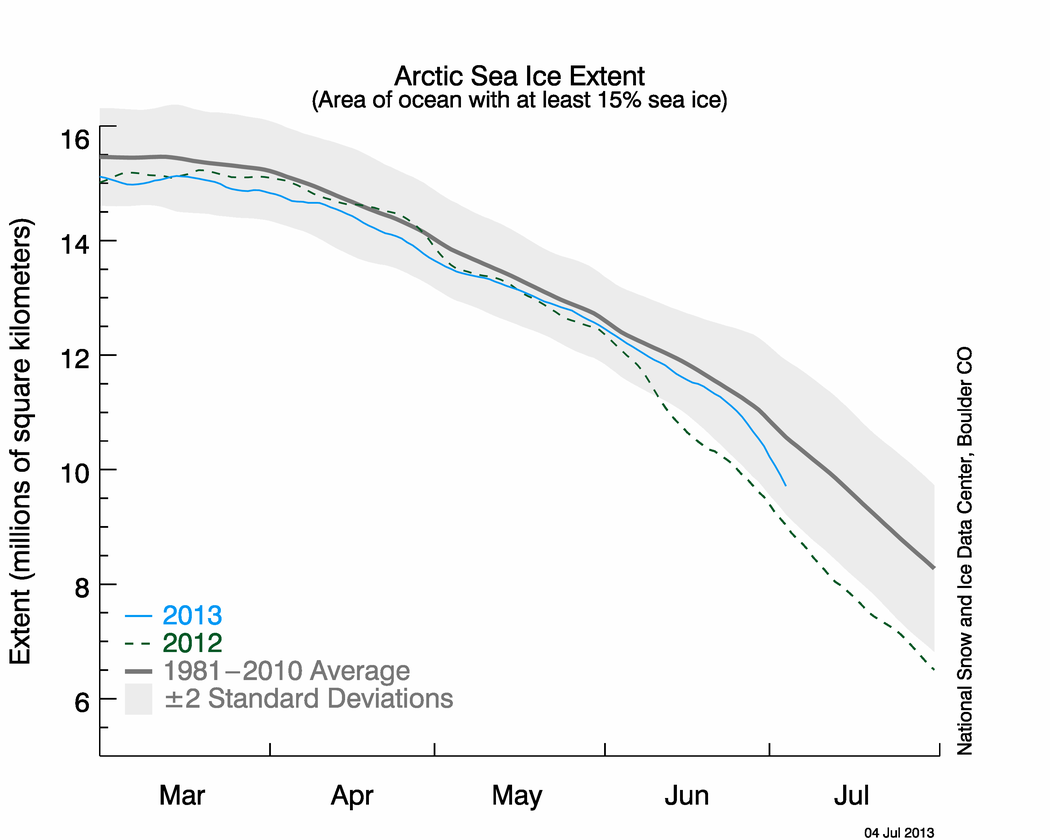
According to the National Snow and Ice Data Center (NSIDC) in Boulder, Colorado, average sea ice extent for June 2013 was 11.58 million square kilometers, or 4.47 million square miles. Overall, this means that sea ice extent is approximately 310,000 square kilometers (120,000 square miles) below the 1981 to 2010 average (the new baseline period) of 11.89 million square kilometers (4.59 million square miles).
The ice was melting more slowly than at this time last year, but it started to melt faster around the end of June, 2013. Temperatures across the region were slightly below average as low pressure was centered over the Arctic throughout June. This atmospheric pattern was almost opposite of what we saw last year when the record-breaking melt occurred across the Arctic. The ice extent dropped an average of 70,300 square kilometers (27,000 square miles) per day through the month of June, slightly higher than the 1981 to 2010 average. Since record keeping began in 1979, June 2013 is ranked as the 11th lowest sea ice extent for the month of June.
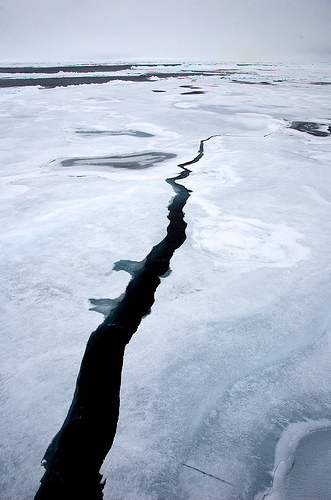
We still have several months of summer left, and we’re sure to see more melting across the Arctic. Ice cover was reported to be very thin during the spring months, which could foreshadow a situation whereby some spots melt out completely by the time August and September roll around. In early March 2013, large fractures were spotted in Arctic sea ice, off the north coast of Alaska and Canada. These fractures suggests that new ice has formed, and new ice tends to be more vulnerable to melting than older, multi-year ice.
For now, in the early 21st century, the annual cycle of ice melting in the summer – and refreezing in the winter – continues. But the rate of ice melting appears to be increasingly great as the climate warms. Projections continue to be heard that the Arctic will become entirely ice free in the summertime within the next 20 to 40 years.

Arctic sea ice extent is important to monitor for several reasons. First of all, the loss of Arctic ice may be playing a major part in changing weather patterns across the Northern Hemisphere. Melting ice and warmer temperatures across the Arctic change the large-scale temperature and pressure gradients at the North Pole, thus altering atmospheric circulations such as the jet stream. The jet stream influences where cold and warm air masses travel, and it can bring extreme weather across the Northern Hemisphere, such as the pattern we are witnessing across the United States in this first week of July 2013.
Another reason to monitor Arctic sea ice loss is that delicate feedback mechanisms are at work there. For example, ice is white and therefore very reflective. An ice-covered Arctic reflects the sun’s heat more efficiently than open water. The more open water in the Arctic, the more absorption of energy from the sun, with a net effect that warming increases. Add to this situation the fact that the permafrost across the Arctic contains methane and carbon, which are major greenhouse gases. If the permafrost melts, the release of these gases could also intensify overall warming.
A third reason is the potential for sea level rise. Consider Greenland, which has a lot of ice. If it began to see significant melting over time, sea level rise would impact coastal cities and, indeed, put some areas under water. This isn’t expected to happen in the immediate future, but it’s sobering.
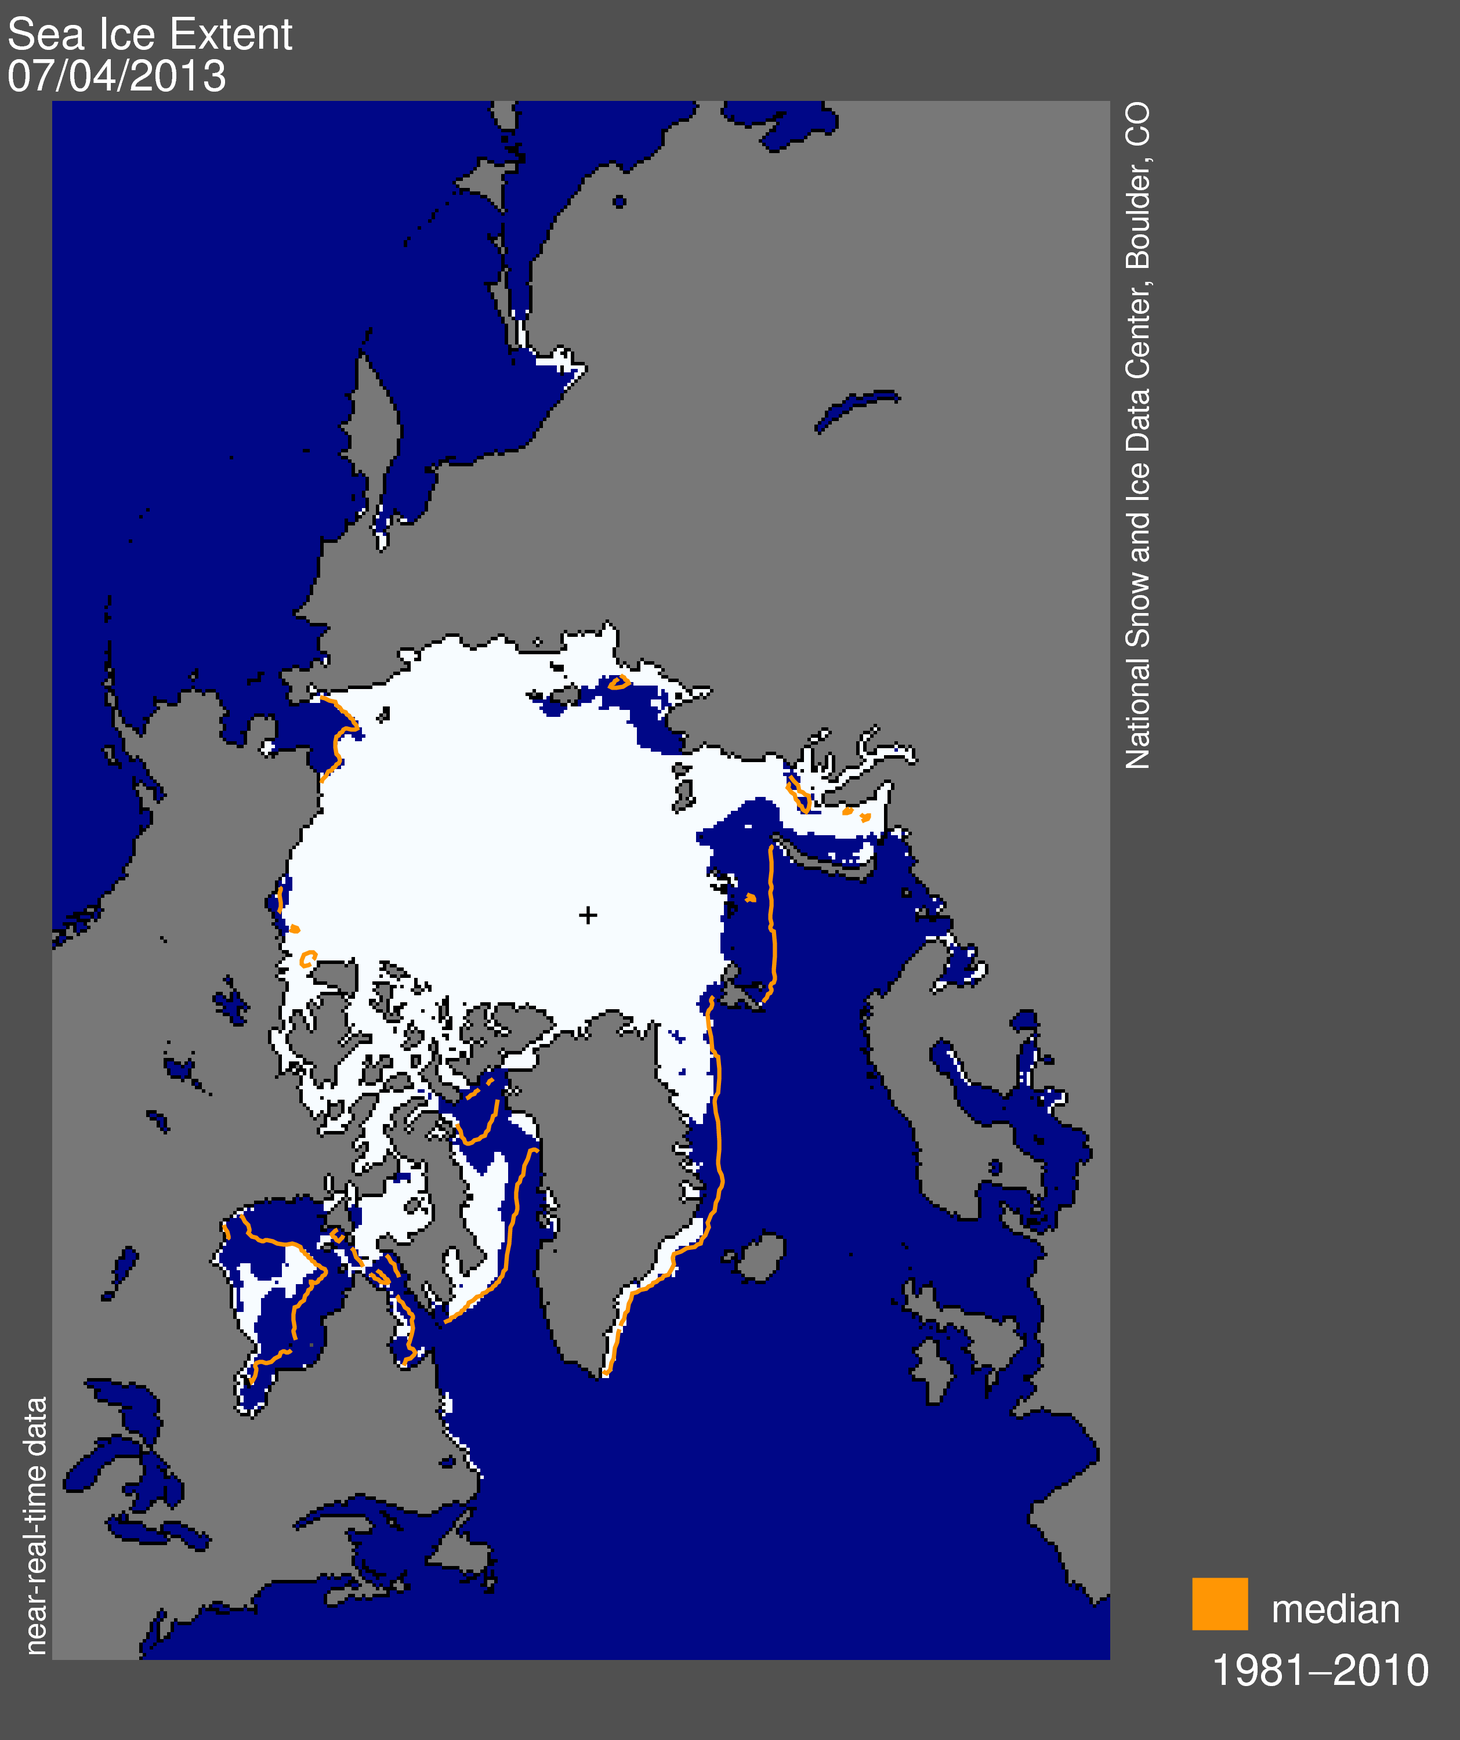
Bottom line: Arctic sea ice extent is below the 1981-2010 average for the end of June 2013, but not as low as it was in 2012 when we experienced record melting across the region. Arctic ice goes through annual cycles of ice growth (winter months) and melt (summer/late fall months). You can monitor the progress of ice melt by visiting the Arctic Sea Ice News & Analysis webpage.
Like what you read?
Subscribe and receive daily news delivered to your inbox.
More from
Matt Daniel