According to the National Oceanic and Atmospheric Administration’s National Climatic Data Center, February 2013 was the 9th-warmest February on record for the globe, tying 2003 at 0.57°C (1.03°F) above the 20th century average of 12.1°C (53.9°F). The global land surface temperatures tied with 2010 as the 11th-warmest February on record. Meanwhile, February global sea surface temperatures were ranked as the 8th-warmest February on record. If you combine the global land and ocean average temperatures together during the period from December 2012 through February 2013, you will find that it was the 12th such warmest period on record. In this post, we will look at the events that took place in February 2013 and show where the warmest/coolest temperatures occurred across the globe and who received the most/least amount of rainfall.
As you can see in the above image, temperatures were above average across Mexico, northwestern Canada, parts of Greenland, northeastern Africa, the Middle East, and Southeast Asia. Temperatures were cooler than average in the southwestern United States, western Europe, Mongolia, eastern Siberia, and Alaska for February 2013. Australia observed its record warmest summer (December-February) ever recorded. According to the Australian Bureau of Meteorology, the average maximum summer temperature was 1.44°C (2.59°F) above the 1961–1990 average, easily beating the previous record set in 1982/83 by 0.21°C (0.38°F).
It is important to note that the last time we had below-average temperatures in the month of February globally was in 1976, and the last below-average month of any kind was December 1984. With this in mind, if you are 27 years old or younger, no month of your life has had below-average temps.

The southeastern United States and north-central India experienced some of the wettest weather across the globe in February 2013. Record dryness occurred over most of Chile, parts of northern Africa, northern Philippines, and in parts of far western Australia. In New Zealand, many areas saw very little rainfall for the month. In fact, Northland, Auckland, and the Bay of Plenty received less than 15 percent of normal precipitation for the month. Meanwhile, Australia saw rainfall that was around 78 percent of average. Some coastal areas did experience plenty of rainfall thanks to various slow moving storm systems. For instance, Tropical Cyclone Rusty brought monthly rainfall in parts of northwestern Australia that was in the highest 10 percent for February. Northern Pakistan experienced so much rain in early February that some areas received totals typically seen for the entire month in just three days.
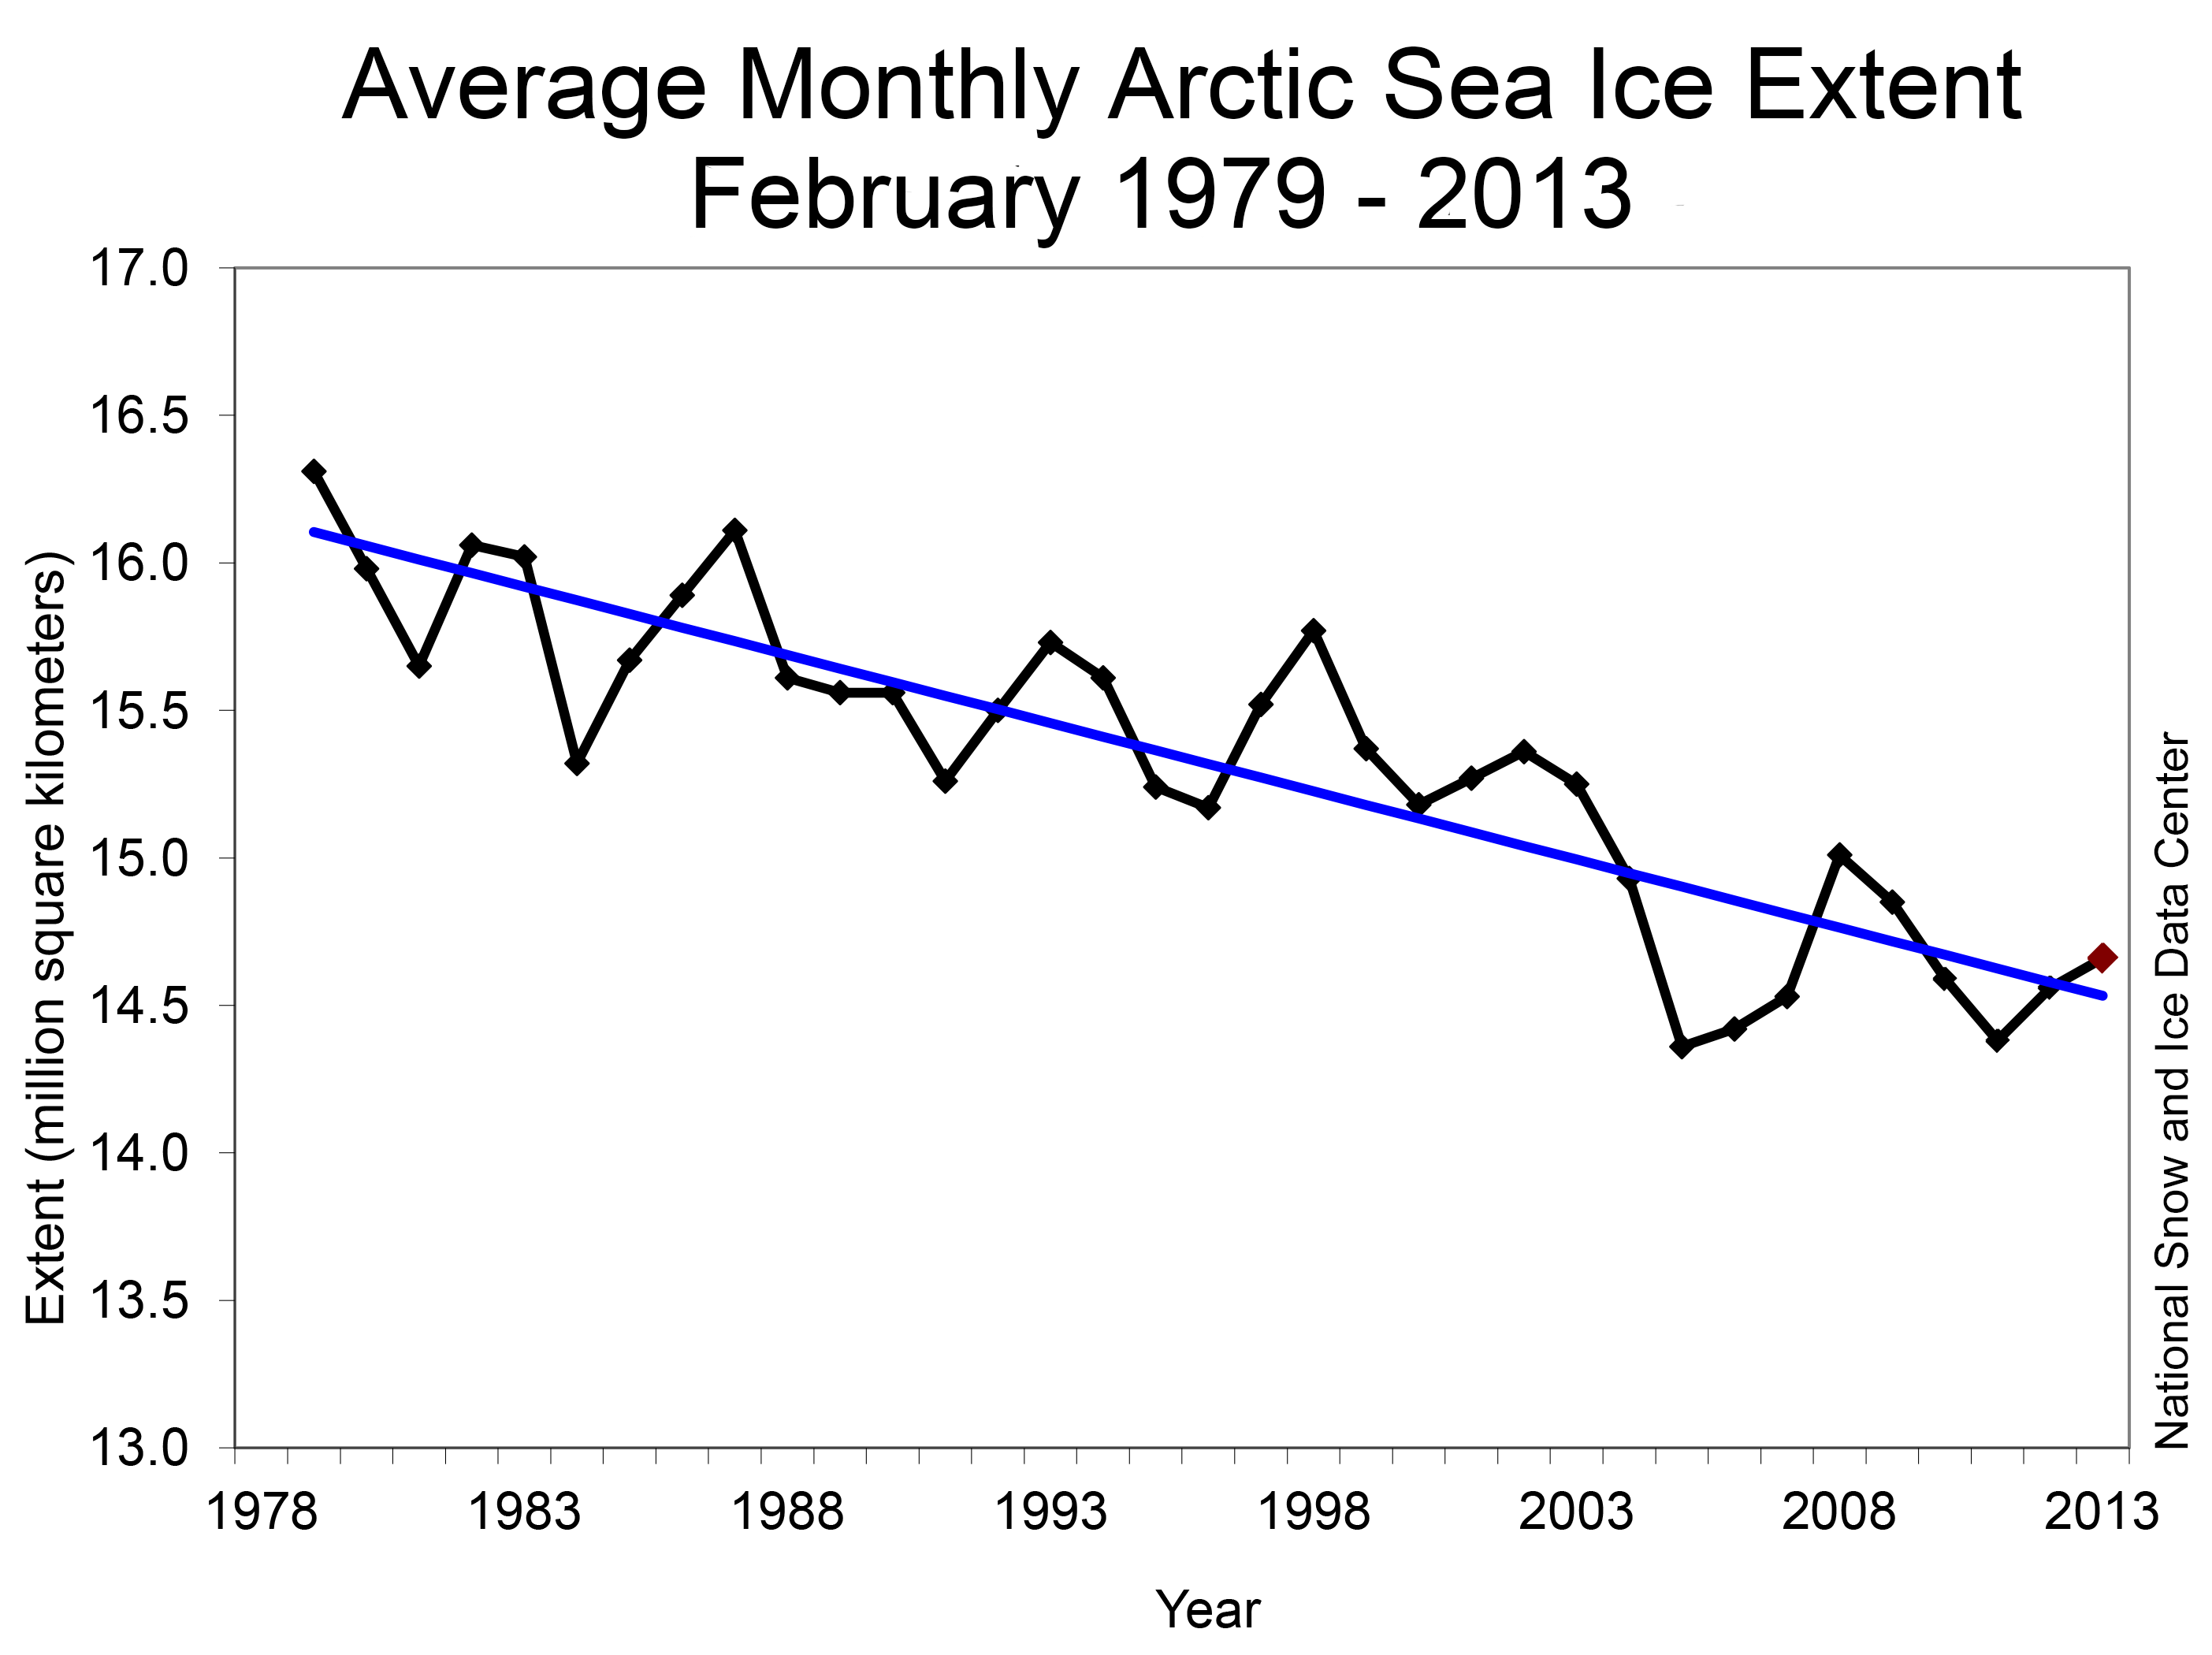
According to the National Snow and Ice Data Center, the average Arctic sea ice extent for February 2013 was 14.66 million square kilometers (5.66 million square miles). This is 980,000 square kilometers (378,000 square miles) below the 1979 to 2000 average for the month, and is the 7th-lowest February extent in the satellite record. Through 2013, the linear rate of decline for February ice extent is -2.9% per decade relative to the 1979 to 2000 average.
Meanwhile, in Antarctica, sea ice extent was 25.9 percent above the 1980-2010 average. This makes it the 3rd-largest sea ice extent on record. Monthly average sea ice extent for February 2013 was 3.83 million square kilometers (1.48 million square miles) and minimum daily sea ice extent for the Antarctic region was 3.68 million square kilometers (1.42 million square miles) on February 20, 2013. According to the NSIDC, unusual circulation patterns, likely resulting from higher-than-average pressure in the Bellingshausen Sea, pushed sea ice in the northwestern Weddell Sea far to the north. Amazing … especially since February is summer for Antarctica.
Bottom line: February 2013 was the 9th-warmest February on record globally. The combined global land and ocean average temperatures during the period from December 2012 through February 2013 was the 12th such warmest period on record. Arctic sea ice extent was ranked as the 7th-lowest February extent in the satellite era. Meanwhile, Antarctica experienced the the 3rd-largest sea ice extent on record.
Like what you read?
Subscribe and receive daily news delivered to your inbox.
More from
Matt Daniel