Originally published by NASA Earth Observatory on June 29, 2021. Reprinted here with permission.
Pacific Northwest heatwave
Extraordinary heat events occur around the planet during most summers, but the recent heatwave in the Pacific Northwest is truly exceptional. In June 2021, all-time temperature records fell in multiple cities in the U.S. and Canada during a heatwave that the National Weather Service called “historic and dangerous.”
The heat began to build up late last week, and the effect is apparent in this map (above) which shows land surface temperatures on June 25, 2021, in Washington state. The data show that around noon on that day, surface temperatures in Seattle reached 120°F (49°C), and the worst was yet to come. By June 26, excessive heat warnings were in place across Washington, Oregon, and Northern California.
Data for the map come from NASA’s ECOsystem Spaceborne Thermal Radiometer Experiment on Space Station (ECOSTRESS), which uses a scanning radiometer to measure thermal infrared energy emitted from Earth’s surface. Note that land surface temperatures are not the same as air temperatures: They reflect how hot the surface of the Earth would feel to the touch and can sometimes be significantly hotter or cooler than air temperatures.
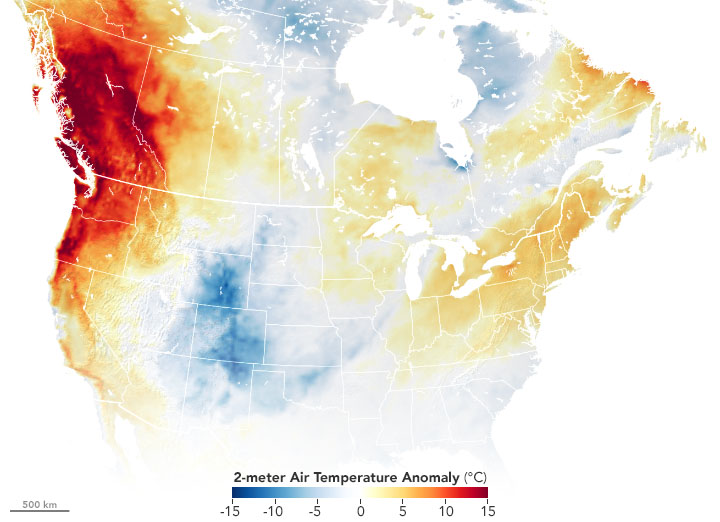
The second map (below) shows air temperature anomalies across the continental United States and Canada on June 27, 2021, when the heat intensified and records started to fall. The map is derived from the Goddard Earth Observing System (GEOS) model and depicts air temperatures at 2 meters (about 6.5 feet) above the ground. Red areas are where air temperatures climbed more than 27°F (15°C) higher than the 2014-2020 average for the same day.
Exceptional heat and all-time highs
The GEOS model, like all weather and climate models, uses mathematical equations that represent physical processes (such as precipitation and cloud processes) to calculate what the atmosphere will do. Actual measurements of physical properties, like temperature, moisture, and winds, are routinely folded into the model to keep the simulation as close to observed reality as possible.
Local ground stations in numerous cities reported all-time record highs on June 27. Seattle reached 104 degrees Fahrenheit (40 degrees C) that day, the city’s hottest temperature ever recorded on any day of the year. All-time records also fell in Oregon, where Portland reached 112 F (44 C). In Canada, the town of Lytton, British Columbia, hit 116 F (47 C), the highest temperature on record anywhere in the country on any date. The heat tops Canada’s previous record of 113 F (45 C) set in July 1937 in Yellow Grass and Midale, Saskatchewan.
According to blog posts by atmospheric scientist Cliff Mass, the extreme heat is the result of the right combination of unusual conditions. Namely, exceptionally high pressure inland and low pressure near the coast have set up a strong flow of air from east to west, helping to push cool ocean air away from the coast. Also, as warm air flows over the Cascade Range, it becomes even warmer as it descends the range’s western slopes.
Forecasts called for temperatures on June 28 to break even more records, followed by some relief as winds from the south to southwest were expected to carry some cooler air inland.
NASA Earth Observatory image by Joshua Stevens, using GEOS-5 data from the Global Modeling and Assimilation Office at NASA GSFC, and data courtesy of Joalda Morancy/NASA/JPL-Caltech and the ECOSTRESS science team. Story by Kathryn Hansen.
Bottom line: This post contains information from NASA Earth Observatory about the dramatic heatwave in the Pacific Northwest in late June 2021.
Like what you read?
Subscribe and receive daily news delivered to your inbox.
More from
EarthSky Voices