Depths of Jupiter’s storms
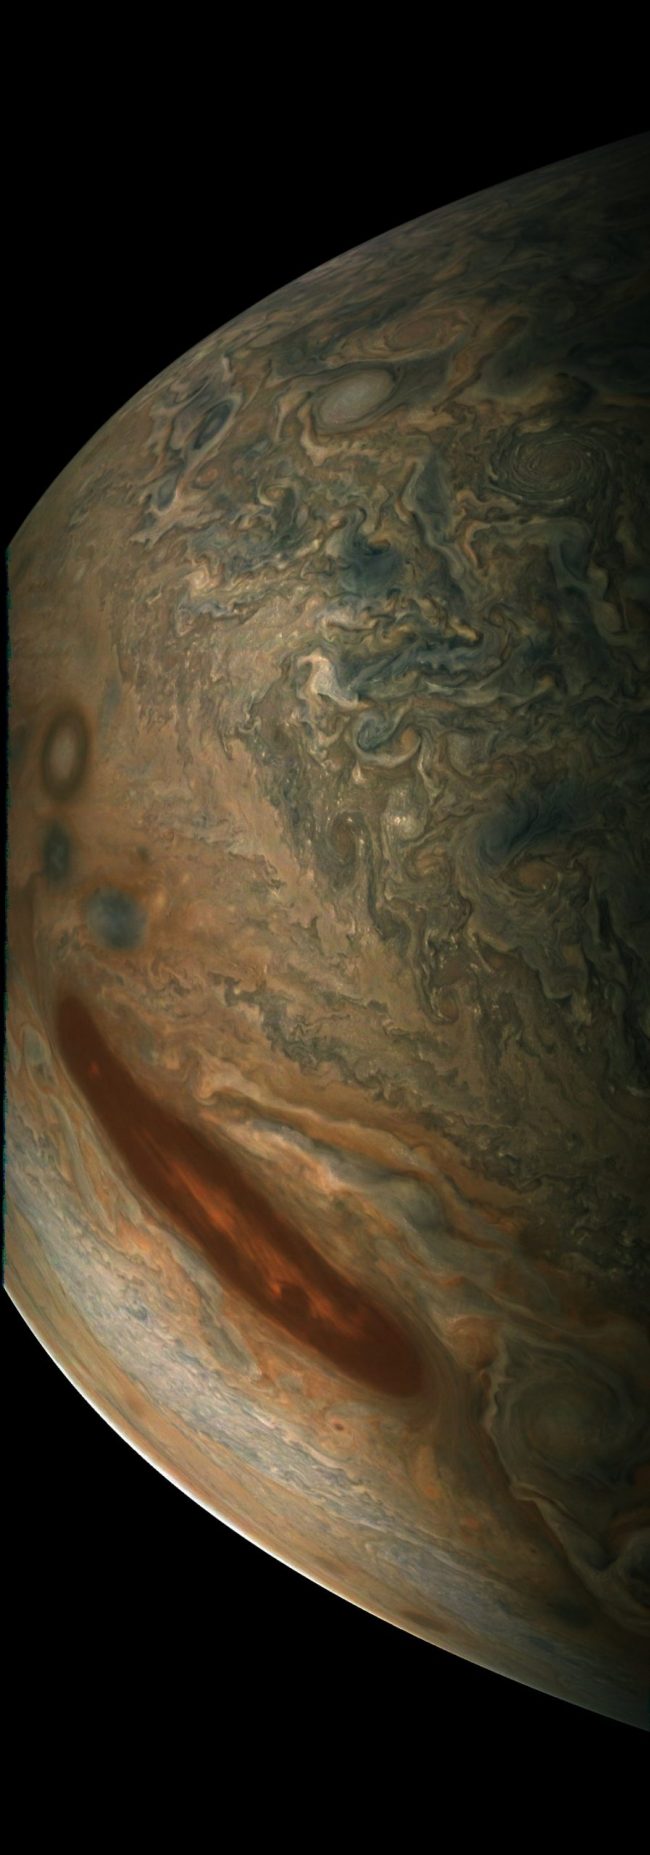
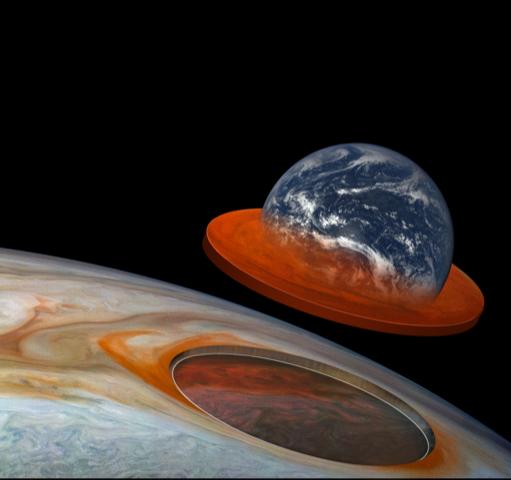
Scientists said on October 28, 2021, that they’ve been able to probe the depths of Jupiter’s storms, thanks to an instrument aboard the Juno spacecraft. Juno has been orbiting Jupiter since 2016. Its microwave radiometer has now enabled scientists to peer into the depths of Jupiter’s rotating storms, including the famous Great Red Spot. Normally, when we look at Jupiter, we see only the top of its atmosphere. But these scientists said this work has let them, in effect, peer below the clouds to determine the height, mass, velocities and temperatures of storms on the giant planet. Jupiter’s Great Red Spot, for example, is now known to extend some 200 miles (300 km) into the planet’s atmosphere.
Scott Bolton, the principal investigator of Juno from the Southwest Research Institute (SwRI) in San Antonio, said:
Previously, Juno surprised us with hints that phenomena in Jupiter’s atmosphere went deeper than expected. Now, we’re starting to put all these individual pieces together and getting our first real understanding of how Jupiter’s beautiful and violent atmosphere works in 3D.
Four published papers recently revealed the scientists’ findings: one in the peer-reviewed journal Science on October 28, 2021, one in the peer-reviewed Journal of Geophysical Research: Planets on October 28, 2021, and two in the peer-reviewed Geophysical Research Letters on October 25, 2021.
Cyclones and anticyclones
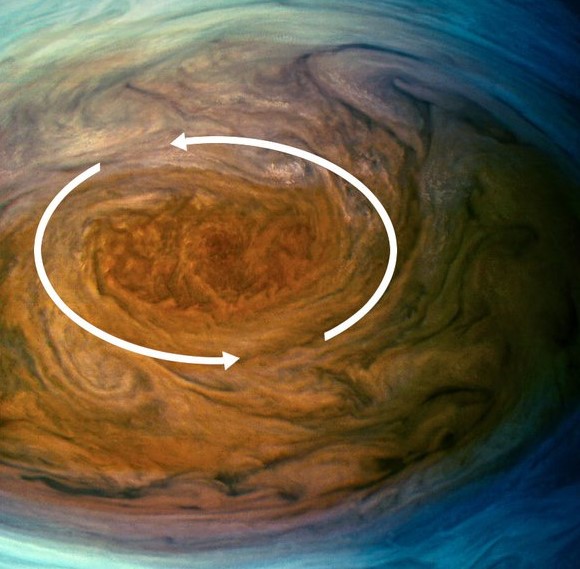
Jupiter has both cyclones, which circulate clockwise, and anticyclones, which circulate counterclockwise. Juno discovered that cyclones have warmer air and lower density at the top, with cooler air and higher densities at the bottom. Anticyclones display the opposite characteristics, with colder air on top of warmer air.
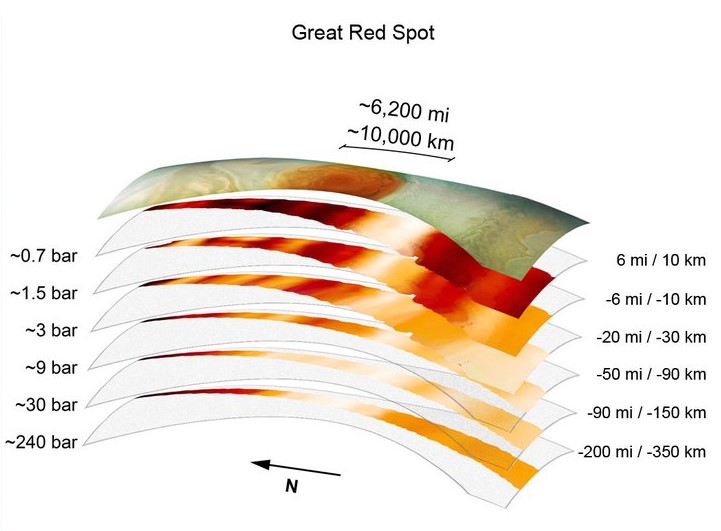
Juno revealed that many of Jupiter’s storms are deeper than scientists expected. Some of the storms extended 60 miles (100 km) below the cloud tops and others, including the Great Red Spot, extended over 200 miles (350 kilometers). Scientists had not expected the storms to go quite this deep. If the storms penetrate that far into Jupiter’s atmosphere, it means they can extend below the height in Jupiter’s atmosphere where sunlight penetrates to warm the atmosphere. They also extend below where water condenses to form clouds.
Confirming their results
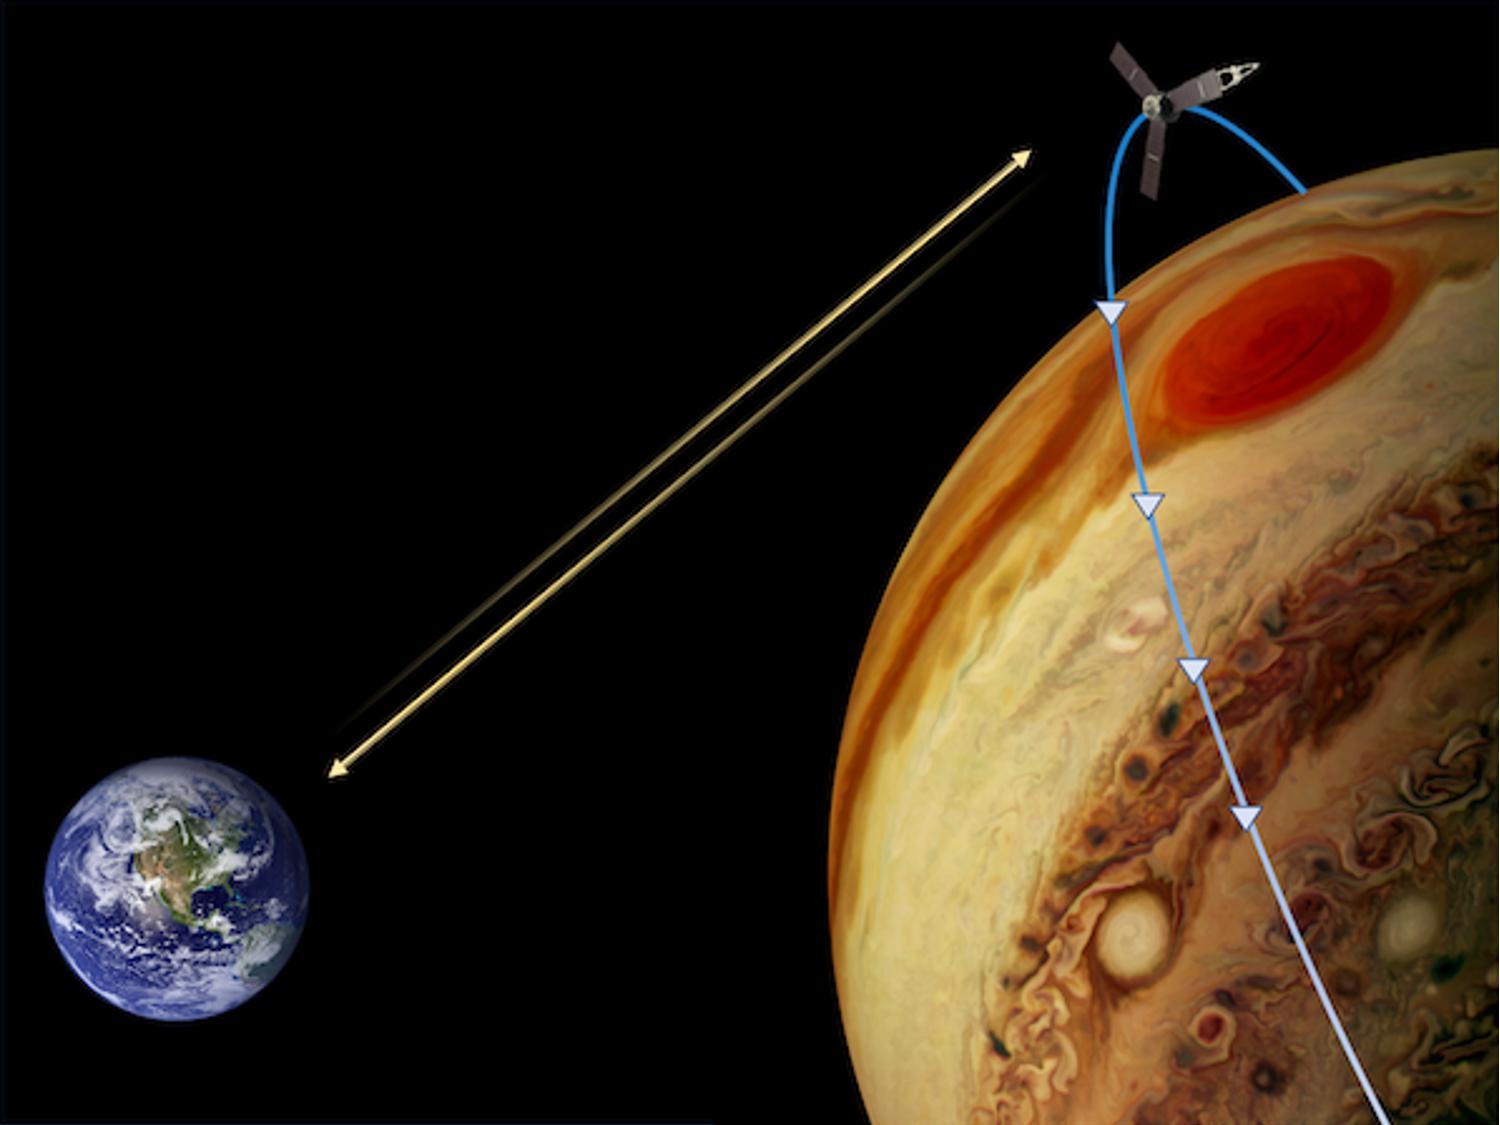
To verify their results, one team of scientists used Juno to measure the storm’s mass using Jupiter’s gravity field. During close flybys over the Great Red Spot, Juno zipped by at 130,000 miles per hour (209,000 kph). These flybys gave scientists the chance to find the storm’s gravity signature, which complements the results for the Great Red Spot’s depth.
From back on Earth, 400 million miles (650 million km) away, NASA’s Deep Space Network measured changes in velocity of 0.01 millimeter per second. The results enabled the scientists to limit the depth of the Great Red Spot to about 300 miles (500 km) below the cloud tops. Marzia Parisi, a Juno scientist from JPL in Southern California and a lead author of a paper in the journal Science, said:
The precision required to get the Great Red Spot’s gravity during the July 2019 flyby is staggering. Being able to complement the microwave radiometer’s finding on the depth gives us great confidence that future gravity experiments at Jupiter will yield equally intriguing results.
Seeing the depths of the belts and zones
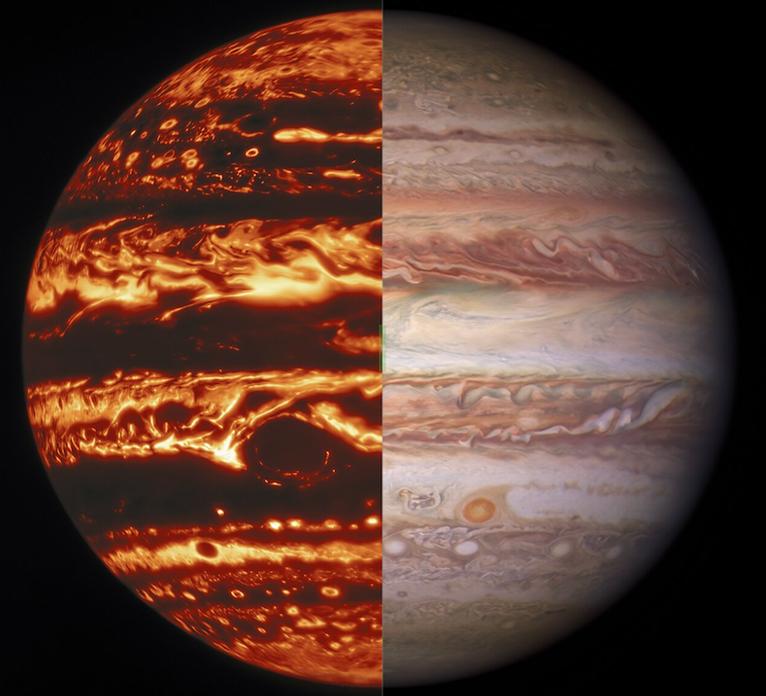
Juno also studied Jupiter’s windy, cloud-swirled belts and zones. These are the primary visible bands around the planet. Scientists call the light-colored ones zones, and the relatively dark ones belts. Data from Juno revealed that the fierce jet stream winds in these belts and zones reached depths of about 2,000 miles (3,200 km). Scientists still don’t know exactly how these jets form. But Juno’s flybys have offered one insight: ammonia gas travels up and down in alignment with the jet streams. As Keren Duer, a lead author of the Science paper and a graduate student of the Weizmann Institute of Science in Israel, said:
By following the ammonia, we found circulation cells in both the north and south hemispheres that are similar in nature to Ferrel cells, which control much of our climate here on Earth. While Earth has one Ferrel cell per hemisphere, Jupiter has eight – each at least 30 times larger.
The Juno data also showed that the belts and zones have a transitional region around 40 miles (65 km) beneath Jupiter’s water clouds. Close to the surface of the clouds, Jupiter’s belts are bright in microwave light compared to zones. At deeper levels, below the water clouds, the opposite is true. This is similar to oceans on Earth. Leigh Fletcher, a Juno scientist from the University of Leicester in the U.K. and lead author of the paper in Journal of Geophysical Research: Planets, said:
We are calling this level the Jovicline in analogy to a transitional layer seen in Earth’s oceans, known as the thermocline, where seawater transitions sharply from being relatively warm to relatively cold.
Revisiting polygonal storms
Juno previously discovered neatly arranged storms at the poles of Jupiter. The north polar region housed eight storms in an octagon, and the south polar region had five storms in a pentagon. The view now, five years later, shows little has changed. Alessandro Mura of the National Institute for Astrophysics in Rome and lead author of the paper in Geophysical Research Letters, described these storms’ resiliency:
Jupiter’s cyclones affect each other’s motion, causing them to oscillate about an equilibrium position. The behavior of these slow oscillations suggests that they have deep roots.
Scientists used Juno’s Jovian Infrared Auroral Mapper (JIRAM) to make this discovery. JIRAM also showed that cyclones on Jupiter want to move poleward, but cyclones already in position at the poles push them back. This discovery explains why the cyclones lie where they do and the different numbers at each pole.
Bottom line: Juno provided data to give scientists a 3D view of Jupiter’s atmosphere, revealing the surprising depths of storms such as the Great Red Spot.
Source: Jupiter’s Temperate Belt/Zone Contrasts Revealed at Depth by Juno Microwave Observations
Source: Evidence for multiple Ferrel-like cells on Jupiter
Source: Jupiter’s overturning circulation: Breaking waves take the place of solid boundaries
Like what you read?
Subscribe and receive daily news delivered to your inbox.
More from
Kelly Kizer Whitt