


With 256 hours of observations (almost 11 days), one sky survey has mapped as many as 25,000 supermassive black holes, each located in the center of a distant galaxy. Despite this large number of black holes, the map covers just 2% of Earth’s sky. See this incredible map in the video above. For scale, notice the size of the moon in the upper left corner. An international team of astronomers working with observations from the LOFAR radio telescope network published the map February 18, 2021, in the peer-reviewed journal Astronomy and Astrophysics.
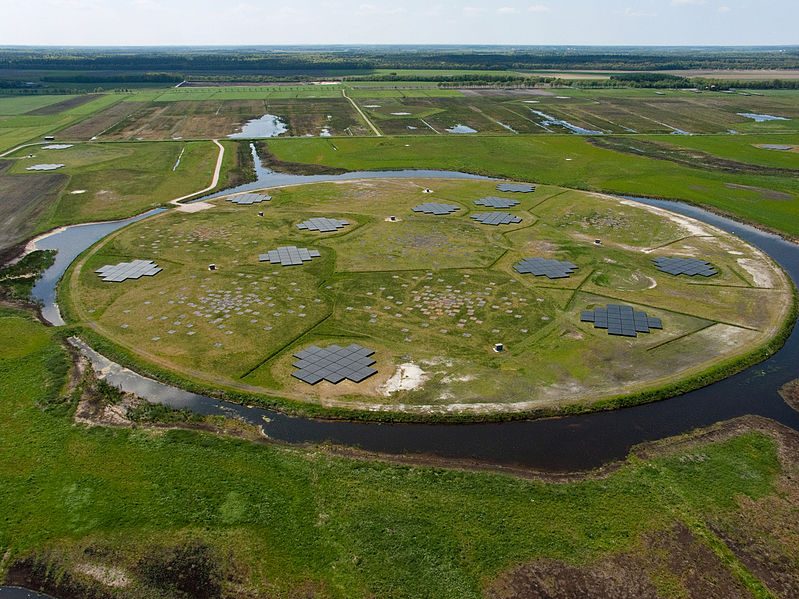
LOFAR stands for Low Frequency Array. It refers to the part of the electromagnetic spectrum where low-frequency (long-wavelength) radio waves can be found. The LOFAR radio telescope is not a single observatory in a single location. Instead, it currently consists of 52 stations spread over nine different European countries: the Netherlands, Germany, Poland, France, United Kingdom, Sweden, Ireland, Latvia and Italy.
The LOFAR radio telescope is the only one presently capable of high-sensitivity, high-resolution observations at ultra-low frequencies. Thus it produces the deepest and most detailed long-radio-wave images around. The ultimate goal of the LOFAR LBA (Low Band Antenna) Survey is to observe the entire northern sky at these low frequencies by pointing the telescope to 3,170 different areas of sky.
Many hours of observing time will be needed to accomplish this goal.
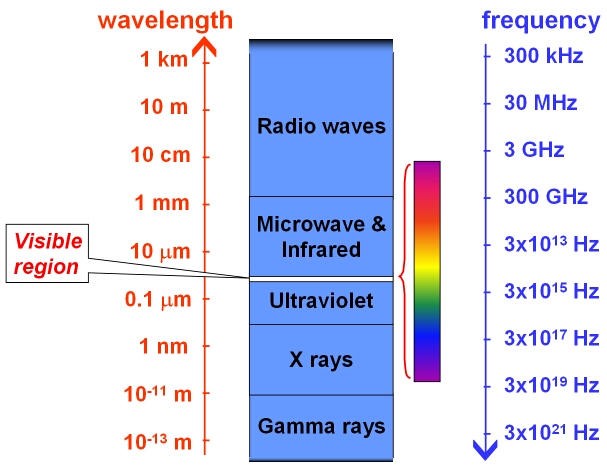
At the ultra-low radio frequencies observed by LOFAR, stars aren’t visible. That fact lets the supermassive black holes – located in distant galaxies beyond our Milky Way galaxy’s relatively nearby stars – become visible. But how can the black holes be seen? Aren’t they, by definition, objects that emit no light? The survey isn’t seeing inside the black holes themselves. Instead, the radio survey is picking up radiation caused by friction between particles speeding around the black holes’ surrounding accretion disks, and also from the jets emanating from them. In this way, what’s invisible becomes visible. The radio waves scientists targeted were around 50 megahertz (MHz) in frequency. This corresponds to a wavelength of about 6 meters (about 6 yards), meaning each electromagnetic wave is 6 meters long or about the height of a full-grown giraffe!
Observations at such long radio wavelengths are particularly challenging due to Earth’s own atmosphere. Earth’s layer of atmosphere called the ionosphere is made up of free electrons moving about and distorting our view outward. As explained by Reinout van Weeren of the Leiden Observatory:
It’s similar to when you try to see the world while immersed in a swimming pool. When you look up, the waves on the water of the pool deflect the light rays and distort the view.
In order to counteract our atmosphere’s turbulence, the researchers used supercomputers and newly created algorithms that corrected for the effect of the ionosphere every four seconds over the course of the 256 hours of observations.
The resulting map – these astronomers say – is 10 times more sensitive than previous maps.
These scientists said they hope their new algorithms – used to pinpoint supermassive black holes on the dome of Earth’s night sky – can be used to help investigate other mysterious objects in the distant universe, for example, in the search for high-redshift galaxies and quasars, to help detect the oldest populations of cosmic rays in galaxies, and to help probe the active cores of galaxies.
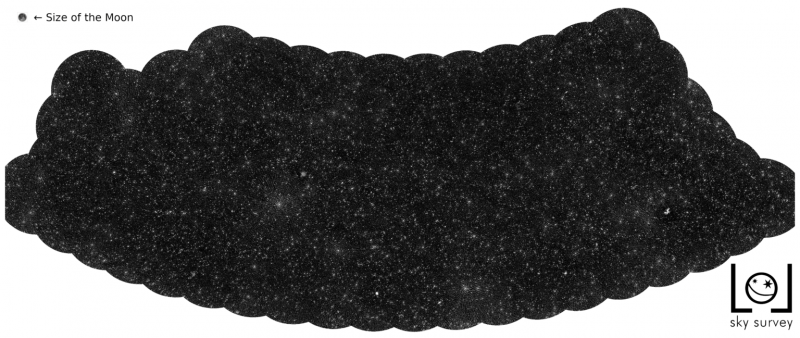
Bottom line: Astronomers used 256 hours of observations with the LOFAR radio telescope network to create a map showing a tiny region of Earth’s night sky, pinpointing the locations of 25,000 supermassive black holes.
Like what you read?
Subscribe and receive daily news delivered to your inbox.
More from
Kelly Kizer Whitt


