


By Kasha Patel/ NASA Earth Observatory
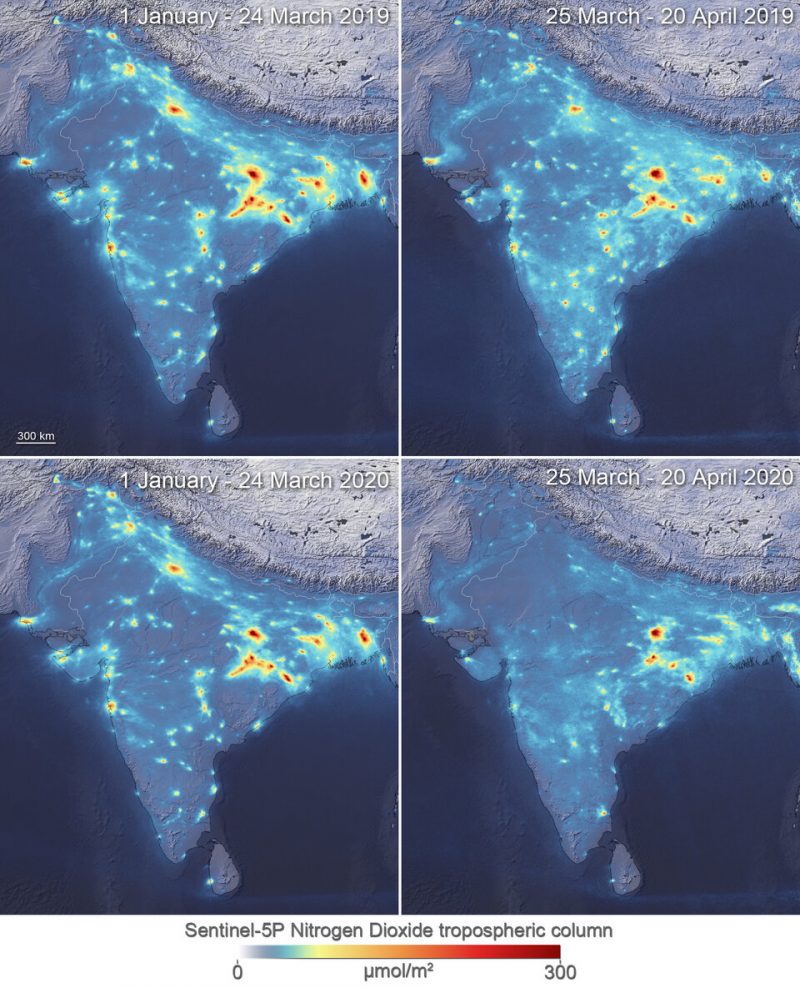
On March 25, 2020, the Indian government placed its 1.3 billion citizens under a strict lockdown to reduce the spread of the Covid-19 coronavirus. The country-wide mandate decreased activity at factories and severely reduced car, bus, truck, and airplane traffic. After just a week of reduced human activities, NASA satellite sensors observed aerosol levels at a 20-year low for this time of year in northern India.
Every year, aerosols from anthropogenic (human-made) sources contribute to unhealthy levels of air pollution in many Indian cities. Aerosols are tiny solid and liquid particles suspended in the air that reduce visibility and can damage the human lungs and heart. Some aerosols have natural sources, such as dust storms, volcanic eruptions, and forest fires. Others come from human activities, such as the burning of fossil fuels and croplands. Human-made aerosols tend to contribute most of the smaller particles that have greater potential for damaging human health.
Pawan Gupta is a Universities Space Research Association (USRA) scientist at NASA’s Marshall Space Flight Center. He said:
We knew we would see changes in atmospheric composition in many places during the lockdown. But I have never seen aerosol values so low in the Indo-Gangetic Plain at this time of year.
In a typical early spring in the Ganges Valley of northern India, human activities generate the majority of aerosols. Motor vehicles, coal-fired power plants, and other industrial sources around urban areas produce nitrates and sulfates; coal combustion also produces soot and other carbon-rich particles. Rural areas add smoke – rich in black carbon and organic carbon – from cooking and heating stoves and from prescribed burns on farms (though farming fires more often occur at other times of year). By all accounts, the 2020 lockdown reduced those human-made emission sources.
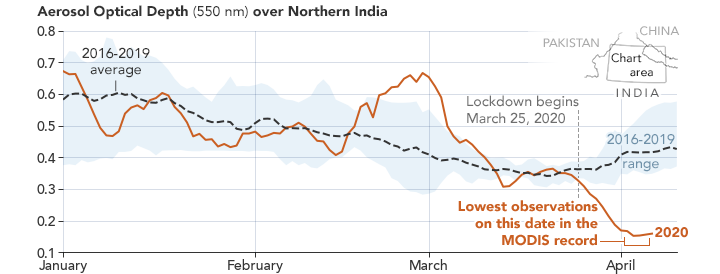
Scientists expect aerosol levels to increase slightly in upcoming weeks in parts of India as seasonal dust storms begin. Dust concentrations are typically low in March and early April, before temperatures rise and strong westerly winds blow sand in from the Thar Desert and Arabian Peninsula. The question is whether overall AOD will remain below normal.
Robert Levy is program leader for NASA’s MODIS aerosol products. He said:
The hard part with understanding aerosols is that particles can move based on wind patterns and other meteorology. You have to disentangle what is caused by the human fingerprint versus a meteorological factor.
In the first few days of the lockdown, it was difficult to observe a change in the pollution signature. Gupta said:
We saw an aerosol decrease in the first week of the shutdown, but that was due to a combination of rain and the lockdown.
Around March 27, heavy rain poured over vast areas of northern India and helped clear the air of aerosols. Aerosol concentrations usually increase again after such heavy precipitation.Gupta added:
After the rainfall, I was really impressed that aerosol levels didn’t go up and return to normal. We saw a gradual decrease, and things have been staying at the level we might expect without anthropogenic emissions.

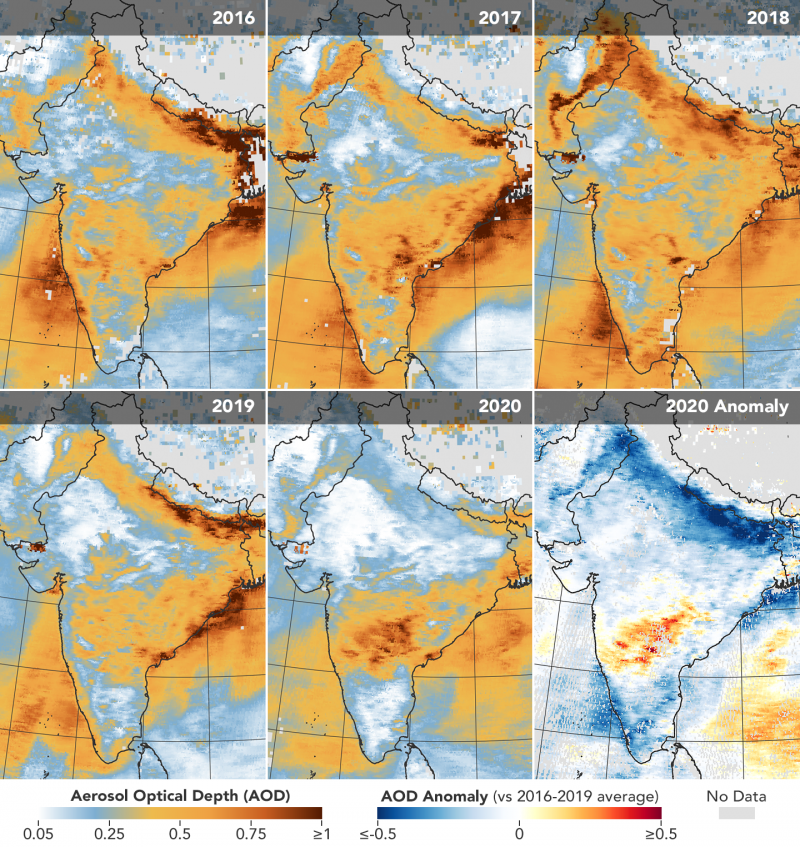
According to Gupta, AOD levels in northern India at the beginning of April were significantly below the norm for this time of year and the lowest in 20 years of MODIS observations. Ground observation stations in India have also reported a decrease in particle pollution in the region. Anecdotally, people in the northern state of Punjab have reported seeing the Himalayas for the first time in decades.
In southern India, though, the story is a little hazier. Satellite data show aerosol levels have not yet decreased to the same extent; in fact, levels seem to be slightly higher than in the past four years. The reasons are unclear, but could be related to recent weather patterns, agricultural fires, winds, or other factors.
According to Levy, the lockdown and its effects on pollution is a model scientific experiment. He said:
We have a unique opportunity to learn how the atmosphere reacts to sharp and sudden reductions in emissions from certain sectors. This can help us separate how natural and human sources of aerosols affect the atmosphere.
What nature really is and how we screwed it up.
This is Dhauladhar mountain range of Himachal, visible after 30 yrs, from Jalandhar (Punjab) after pollution drops to its lowest level. This is approx. 200 km away straight. #Lockdown21 #MotherNature #Global healing. pic.twitter.com/cvZqbWd6MR
— Diksha Walia (@Deewalia) April 3, 2020
Bottom line: Satellite data show that aerosol levels over northern India have dropped significantly since the Covid-19 lockdown began.
Like what you read?
Subscribe and receive daily news delivered to your inbox.
More from
EarthSky Voices


