


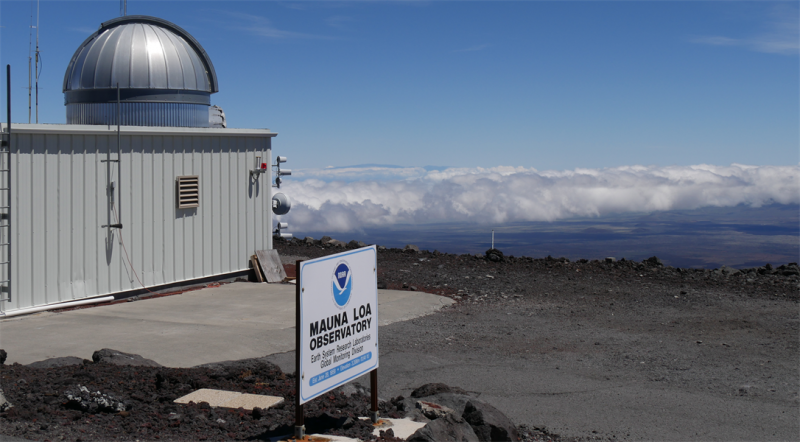
The amount of carbon dioxide (CO2) in Earth’s atmosphere continues to rise, say scientists. On June 4, 2020, scientists from NOAA and Scripps Institution of Oceanography announced that atmospheric CO2 measured at Mauna Loa Observatory in Hawaii reached a seasonal peak of 417.1 parts per million for 2020 in May, the highest monthly reading ever recorded.
Meanwhile, a new study, published May 29, 2020, in Geology, concludes that today’s carbon dioxide (CO2) levels are higher than they have been for the past 23 million years. The study’s CO2 timeline revealed no evidence for any fluctuations in CO2 that might be comparable to the dramatic CO2 increase of the present day, suggesting that today’s abrupt greenhouse disruption is unique across recent geologic history. Read more about the study here.
Pieter Tans, senior scientist with NOAA’s Global Monitoring Laboratory, said in a statement:
Progress in emissions reductions is not visible in the CO2 record. We continue to commit our planet – for centuries or longer – to more global heating, sea level rise, and extreme weather events every year.
If humans were to suddenly stop emitting CO2, it would take thousands of years for our CO2 emissions so far to be absorbed into the deep ocean and atmospheric CO2 to return to pre-industrial levels.
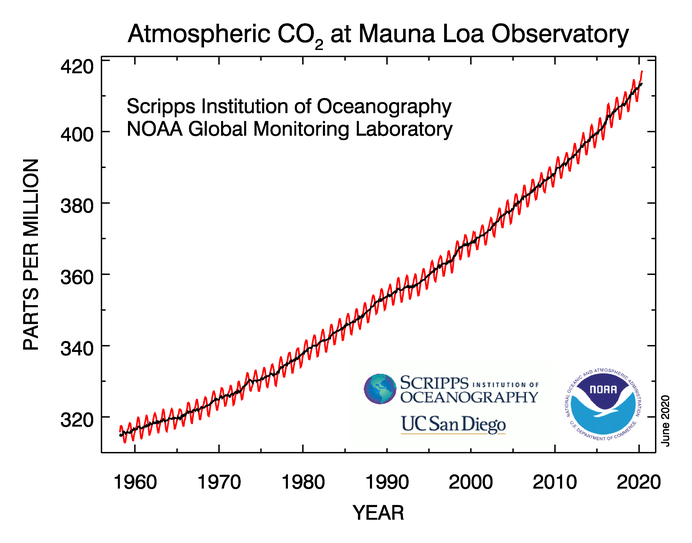
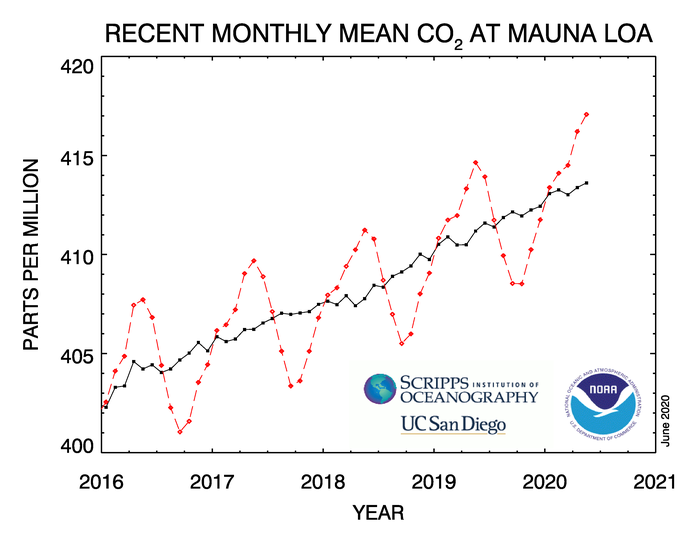
According to the NOAA report, this year’s peak value was 2.4 parts per million (ppm) higher than the 2019 peak of 414.7 ppm recorded in May 2019. NOAA scientists reported a May average of 417.1 ppm. Scripps scientists reported a May average of 417.2 ppm. Monthly carbon dioxide (CO2) values at Mauna Loa first breached the 400 ppm threshold in 2014, and are now at levels not experienced by the atmosphere in several million years.
The rate of increase during 2020 does not appear to reflect reduction in pollution emissions due to the sharp, worldwide economic slowdown in response to the coronavirus pandemic. The reason, says NOAA, is that the drop in emissions would need to be large enough to stand out from natural CO2 variability, caused by how plants and soils respond to seasonal and annual variations of temperature, humidity, soil moisture, etc. These natural variations are large, and so far the emissions reductions associated with COVID19 do not stand out. If emissions reductions of 20% to 30% were sustained for six to 12 months, then the rate of increase of CO2 measured at Mauna Loa would be slowed.
Geochemist Ralph Keeling runs the Scripps Oceanography program at Mauna Loa. He said:
People may be surprised to hear that the response to the coronavirus outbreak hasn’t done more to influence CO2 levels. But the buildup of CO2 is a bit like trash in a landfill. As we keep emitting, it keeps piling up. The crisis has slowed emissions, but not enough to show up perceptibly at Mauna Loa. What will matter much more is the trajectory we take coming out of this situation.
Even though terrestrial plants and the global ocean absorb an amount of CO2 equivalent to about half of the 40 billion tons of CO2 pollution emitted by humans each year, the rate of CO2 increase in the atmosphere has been steadily accelerating. In the 1960s, the annual growth averaged about 0.8 ppm per year. It doubled to 1.6 ppm per year in the 1980s and remained steady at 1.5 ppm per year in the 1990s. The average growth rate again surged to 2.0 ppm per year in the 2000s, and increased to 2.4 ppm per year during the last decade.
Tans said:
There is abundant and conclusive evidence that the acceleration is caused by increased emissions … Well-understood physics tells us that the increasing levels of greenhouse gases are heating Earth’s surface, melting ice and accelerating sea-level rise. If we do not stop greenhouse gases from rising further, especially CO2, large regions of the planet will become uninhabitable.
Bottom line: A NOAA report released in June 2020 says that atmospheric carbon dioxide (CO2) measured at Hawaii’s Mauna Loa Observatory for May 2020 was the highest monthly reading ever recorded.
Source: A 23 m.y. record of low atmospheric CO2
Like what you read?
Subscribe and receive daily news delivered to your inbox.
More from
Eleanor Imster


