By Mathieu Morlighem, Dartmouth College
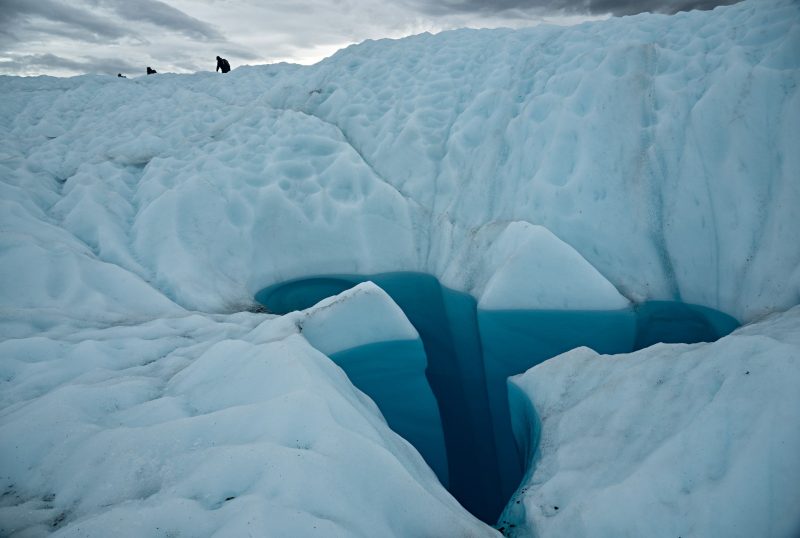
Mountain glaciers are essential water sources for nearly a quarter of the global population. But figuring out just how much ice they hold – and how much water will be available as glaciers shrink in a warming world – has been notoriously difficult.
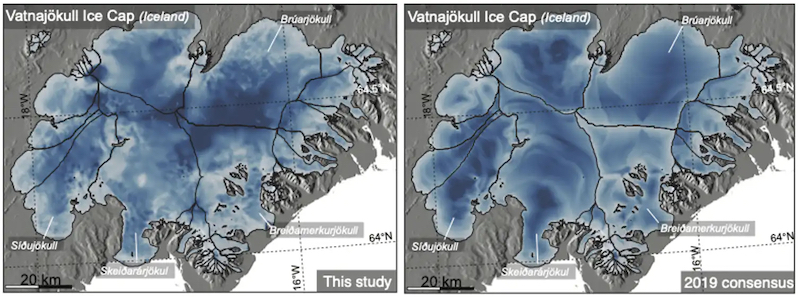
In a new peer-reviewed study that Nature Geoscience published February 7, 2022, scientists mapped the speed of over 200,000 glaciers to get closer to an answer. They discovered that widely used estimates of glacier ice volume may be off by about 20% in terms of how much Earth’s glaciers outside the Greenland and Antarctic ice sheets could contribute to sea level rise.
Mathieu Morlighem, a leader in ice sheet modeling and a coauthor of the study, explains why the new results hold a warning for regions that rely on glaciers’ seasonal meltwater, but barely register in the big picture of rising seas.
The 2022 lunar calendars are still available. Order yours before they’re gone!
1) If mountain glaciers hold less ice than previously believed, what does that mean for people who depend on glaciers for water?
Globally, almost 2 billion people rely on mountain glaciers and snowpack as their main source of drinking water. Many also rely on glacier water for hydropower generation or agriculture, particularly in the dry season. But the vast majority of glaciers around the world are losing more mass than they gain during the year as the climate warms, and they are slowly disappearing. That will profoundly affect these populations.
These communities need to know how long their glaciers will continue to provide water and what to expect as the glaciers disappear so they can prepare.
In most places, we found significantly lower total ice volumes than previous estimates indicated.
In the tropical Andes, from Venezuela to northern Chile, for example, we found that the glaciers have about 23% less ice than previously believed. This means downstream populations have less time to adjust to climate change than they may have planned for.
Even in the Alps, where scientists have a lot of direct ice thickness measurements, we found that the glaciers may have 8% less than previously thought.
The big exception is the Himalayas. We calculated that there may be 37% more ice in these remote mountains than previously estimated. This buys some time for communities that rely on these glaciers, but it does not change the fact that these glaciers are melting with global warming.
Policymakers should look at these new estimates to revise their plans. We do not provide new predictions of the future in this study, but we do provide a better description of what the glaciers and their water supplies look like today.
2) How do these findings affect estimates of future sea level rise?
First, it’s important to understand that melting glaciers are only one contributor to sea level rise as the climate warms. About 1/3 of today’s sea level rise is due to thermal expansion of the ocean; as the ocean warms, water expands and takes up more space. The other two-thirds come from shrinking mountain glaciers and ice sheets.
We found that if all the glaciers, not including the big ice sheets in Greenland and Antarctica, were to melt entirely, sea level would rise by about 10 inches instead of 13 inches. This may sound like a large difference, considering the size of the ocean, but you have to put things in perspective. A complete disintegration of the Antarctic ice sheet would contribute 190 feet (58 meters) to sea level and the Greenland ice sheet would contribute 24 feet (7.3 meters).
The three inches (8 cm) that we are talking about in this study do not call into question current projections of sea level rise.
3) Why has it been so hard to figure out the ice volume of glaciers, and what did your study do differently?
You might be surprised by how much is still unknown about some of the basic characteristics of remote mountain glaciers.
Satellites have transformed our understanding of glaciers since the 1970s, and they provide an increasingly clear picture of glacier locations and surface area. But satellites cannot see “through” the ice. In fact, for 99% of the world’s glaciers, there is no direct measurement of ice thickness. Scientists have spent more time mapping the Greenland and Antarctica ice sheets and the terrain below, and we have much more detailed volume measurements there. NASA, for example, dedicated an entire airborne mission, Operation IceBridge, to collect ice thickness measurements in Greenland and Antarctica.
Scientists have come up with various techniques to determine the volume of glaciers, but the uncertainty for remote mountain glaciers has been pretty high.
We did something different compared to previous studies. We used satellite imagery to map the glaciers’ speed. Glacier ice, when it is thick enough, behaves like thick syrup. We can measure how far the ice is moving using two satellite images and map its speed, which goes from a few feet (1 meter) to about 1 mile (1 1/2 km) per year. Mapping the displacement of more than 200,000 glaciers was no easy task, but that created a data set nobody had seen before.
We used this new information of ice speed and simple principles of ice deformation to determine the thickness of the ice at each pixel of these satellite images. In short, the ice speed we observe from space is due to the ice sliding on its bed and also its internal deformation. The internal deformation depends on its surface slope and ice thickness, and the slipperiness of its bed depends on the temperature of the ice at its base, the presence or absence of liquid water and the nature of the sediments or rocks underneath. Once we could calibrate a relationship between ice speed and sliding, we could calculate ice thickness.
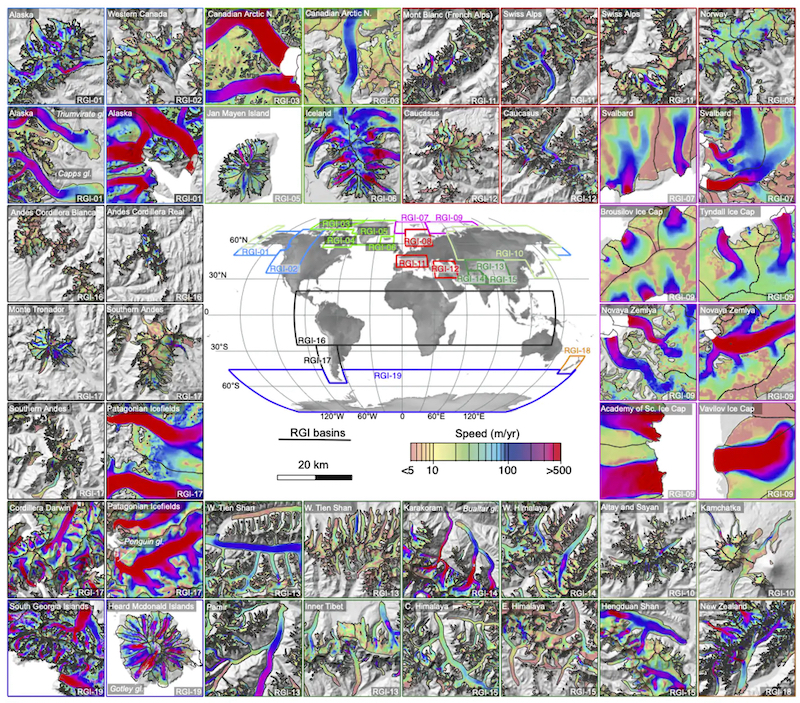
To map the flow speed of all of these glaciers, we analyzed 800,000 pairs of images collected by satellites from the European Space Agency and NASA.
Of course, as with any indirect method, they are not perfect estimates and they will be further improved as we collect more data. But we have made a lot of progress in reducing the overall uncertainty.![]()
Mathieu Morlighem, Professor of Earth Sciences, Dartmouth College
This article is republished from The Conversation under a Creative Commons license. Read the original article.
Bottom line: A new atlas shows that there is less ice in many of the world’s mountain glaciers, which will have an impact on communities that rely on that water.
Like what you read?
Subscribe and receive daily news delivered to your inbox.
More from
Kelly Kizer Whitt