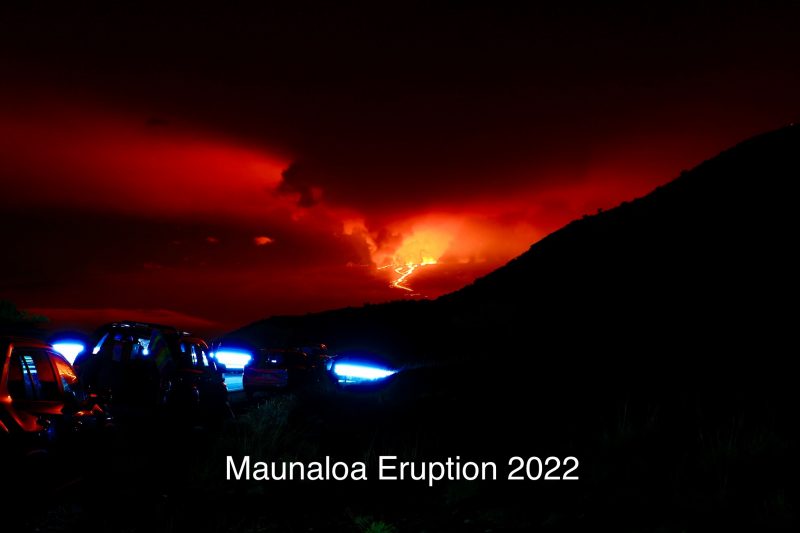
On November 28, 2022, Mauna Loa – world’s largest active volcano – erupted for the first time in 38 years. So far, there’ve been no reports of property damage and no deaths. But Mauna Loa Observatory is home to a famous and historic science endeavor, which, since 1958, has provided nearly continuous direct measurements of heat-trapping carbon dioxide in Earth’s atmosphere. The measurements are used to illustrate what’s called the Keeling Curve, iconic evidence of a rapidly warming Earth. But – five hours after the volcanic eruption began on November 28 – the equipment measuring the carbon dioxide in Earth’s atmosphere lost power. At this writing, it remains offline.
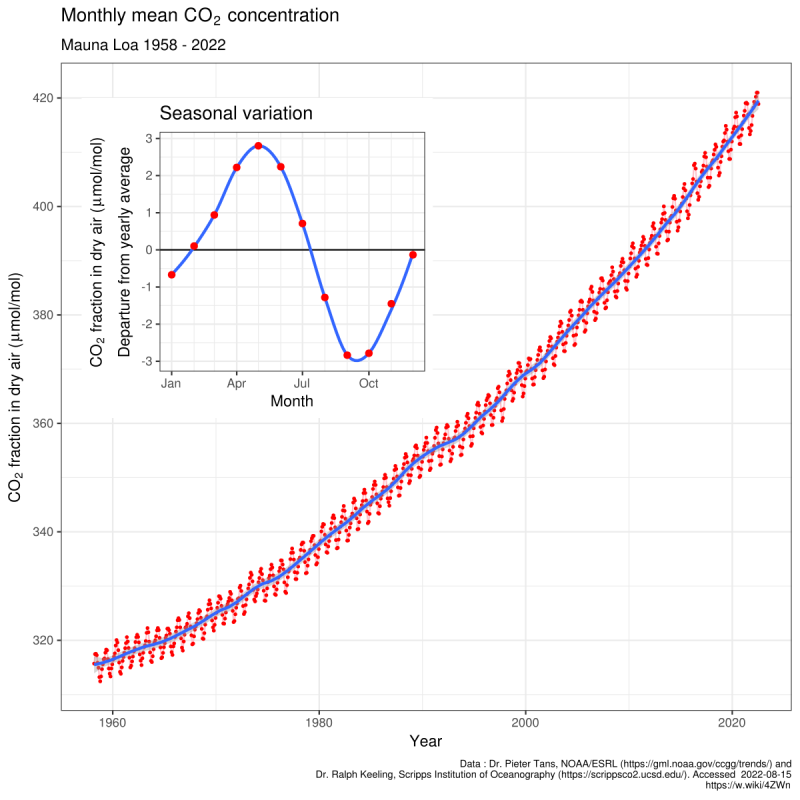
The Keeling Curve is dramatic and important. It shows, for example, that when these measurements of atmospheric CO2 began in 1958, the concentration of carbon dioxide in Earth’s atmosphere was approximately 315 parts per million (ppm).
In 2021, according to measurements taken at Mauna Loa and elsewhere around the globe, the Keeling Curve hit 420 ppm for the first time in human history.
Measurements of the Keeling Curve have been nearly continuous since 1958. A brief funding issue in 1964 and the last eruption in 1984 created small blips in the record. But the newest eruption could have the equipment offline for months, according to a statement from the Scripps Institution of Oceanography, which oversees the effort.
Scripps geoscientist Ralph Keeling, son of Keeling Curve originator Charles David Keeling, said of the current eruption of Mauna Loa:
It’s a big eruption and it’s in a bad place.
The Keeling Curve, consisting of carbon dioxide measurements from the Mauna Loa Observatory, is one of the most iconic time series in science.
It is now offline, possibly for months, due to the eruption of Mauna Loa ?.https://t.co/6Ki9OgTHG9 pic.twitter.com/TfiKeM1m5W
— Dr. Robert Rohde (@RARohde) November 30, 2022
What is the Keeling Curve?
The Keeling Curve is a daily record of global atmospheric carbon dioxide concentrations in Earth’s atmosphere. Charles David Keeling of the Scripps Institution of Oceanography made the original carbon dioxide measurements at Mauna Loa Observatory in 1958. This nearly uninterrupted record spanning more than 60 years has been a key authority showing the steady climb of carbon dioxide in Earth’s atmosphere. As the website for the Keeling Curve, hosted by the University of California San Diego, stated, the Keeling Curve:
… has provided incontrovertible evidence that the amount of the gas carbon dioxide has risen far above any levels experienced on Earth for at least three million years. Additional study has shown that the only plausible cause of the warming caused by the increase in concentrations of that gas is the use of fossil fuels by society.
What the Keeling Curve records
The video below shows Ralph Keeling explaining how the carbon-dioxide measurements are taken and analyzed.
The Keeling Curve does not proceed straight upward but has a jagged up-and-down pattern that, over time, creates an upward trend. That’s because carbon dioxide follows a seasonal cycle. The bulk of land mass and plants are in the Northern Hemisphere. During a Northern Hemisphere summer, plants take up carbon dioxide, reducing the amount in the atmosphere. Therefore, during winter, the amounts of carbon dioxide are higher than in summer.
Why is it located on Mauna Loa?
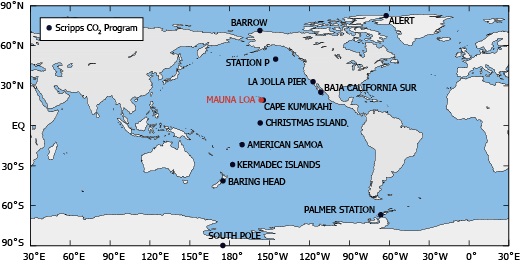
Charles David Keeling considered the Mauna Loa Observatory a good site for his carbon-dioxide recording equipment because it was located far from outside influences. Also, at its location on the Big Island of Hawaii, it’s away from major land masses. In addition, its location atop a volcanic mountain put it far from vegetation, keeping it free of contamination of photosynthesis by surrounding plants.
However, while the Mauna Loa location is the longest record of this data, there are now other locations around the world performing the same monitoring. You can see the locations from the map below. Of course, the other stations will pick up the slack while the Mauna Loa station is offline. As Ralph Keeling told CNN:
We probably can survive this, but it’s still a really key indicator that we hate to lose.
Bottom line: Mauna Loa Observatory is the location of the historic carbon-dioxide data that measures the Keeling Curve. The November 2022 volcanic eruption may interrupt this important recording for months.
Via Scripps Institution of Oceanography at UC San Diego
For updates, follow @Keeling_Curve on Twitter.
Like what you read?
Subscribe and receive daily news delivered to your inbox.
More from
Kelly Kizer Whitt