2019 State of the Climate Report: Peak greenhouse gases and record heat
On August 12, 2020, the American Meteorological Society released State of the Climate Report for 2019. An international, peer-reviewed publication released each summer, the State of the Climate Report is a review of the world’s climate, based on contributions from more than 520 scientists in over 60 countries. It offers insight on global climate indicators, extreme weather events and other environmental data.
The 2019 report is the 30th annual such report. According to it, in 2019, climate records were, once more, either challenged or broken. 2019 now ranks among the world’s three hottest years. What’s more, greenhouse gases peaked in 2019 to their highest levels on record. Plus, the six warmest years on record have all occurred in the past six years, since 2014.
The State of the Climate report is led by scientists from NOAA’s National Centers for Environmental Information and published by the Bulletin of the American Meteorological Society. Read the complete report here.
According to a statement from NOAA, notable findings from the international report include:
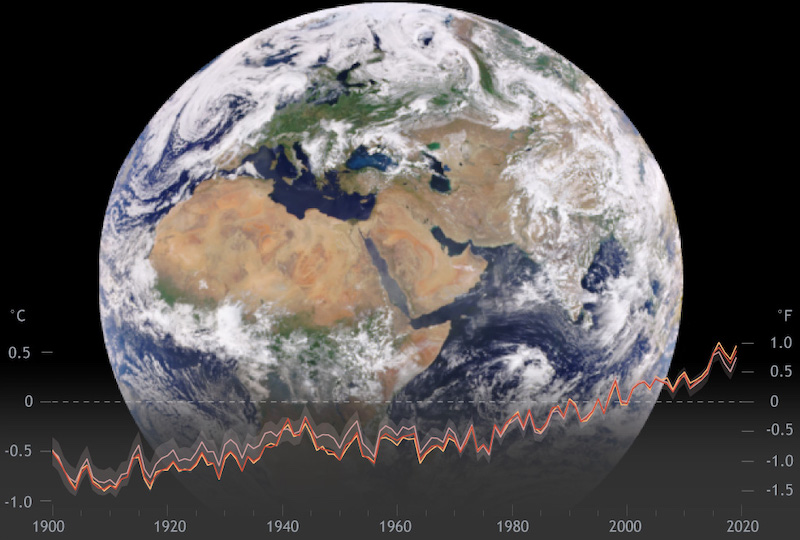
– Last year continued Earth’s warming trend. The globally averaged annual surface temperature was 0.79–1.00 degrees Fahrenheit (0.44–0.56 degrees Celsius) above the 1981–2010 average depending upon the dataset used. More specifically, NOAA and NASA both found 2019 to be the second-hottest year on record, behind 2016, while the United Kingdom’s Met Office ranked 2019 as the third-hottest year, behind 2016 and 2015 respectively.
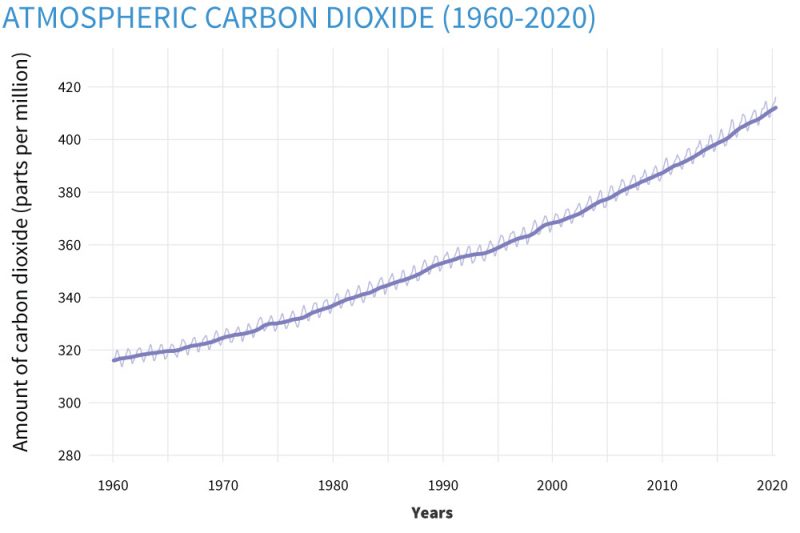
– Earth’s greenhouse gases were at their highest level on record. Continuing their rise, major greenhouse gas concentrations in the atmosphere – including carbon dioxide (CO2), methane and nitrous oxide – all reached another record in 2019. The global annual average atmospheric CO2 concentration was 409.8 parts per million (ppm). This was 2.5 ppm greater than 2018 amounts and was the highest in the modern 61-year measurement record as well as the highest ever measured in ice core records dating back as far as 800,000 years.
– Sea-surface temperatures were near-record warm. The globally averaged 2019 sea surface temperature was the second highest on record, surpassed only by the record El Niño year of 2016.
– Sea levels were the highest on record, again. For the eighth consecutive year, global average sea level rose to a new record high and was about 3.4 inches (87.6 mm) higher than the 1993 average, the year that marks the beginning of the satellite altimeter record. Global sea level is rising at an average rate of 1.3 inches (3.2 cm) per decade. Melting of glaciers and ice sheets, along with warming oceans, account for the trend in rising global mean sea level.
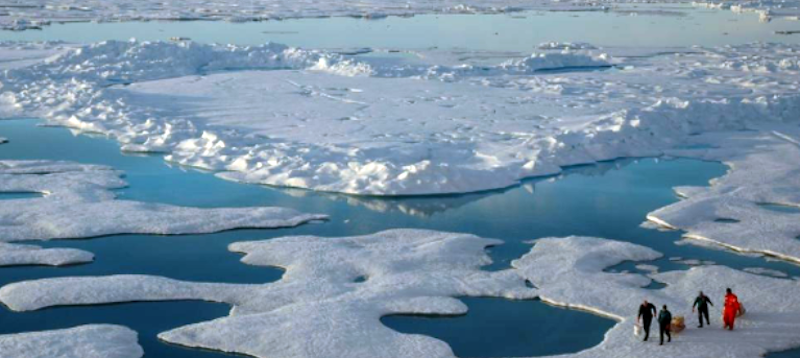
– The Arctic and Antarctic saw near-record warmth. The annual mean surface air temperature for the Arctic land areas was the second highest in the 120-year record, trailing only 2016. In the Antarctic, 2019 was the second warmest year for the continent as a whole since the start of the reanalysis record in 1979, surpassing 2018 and behind only 1980.
– The Indian Ocean dipole affected weather from Africa to Australia. The Indian Ocean dipole – measured as the difference between sea-surface temperature departure from average in the eastern and western Indian Ocean -contributed to heavy rainfall over the Horn of Africa from October through December 2019, resulting in widespread flooding across East Africa. Meanwhile, record heat and dryness in Australia intensified drought conditions already in place, leading to severe impacts during late austral spring and summer, including catastrophic wildfires.
Bottom line: 2019 ranks among the three warmest years in records dating to the mid-1800s. In 2019, greenhouse gases reached their highest levels on record. Both facts are from the 30th annual State of the Climate report, a review of world climate based on contributions from more than 520 scientists in over 60 countries.
Like what you read?
Subscribe and receive daily news delivered to your inbox.
More from
Editors of EarthSky