By Bob Henson, NCAR/UCAR AtmosNews
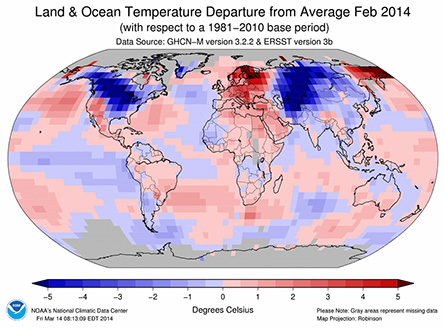
Old Man Winter seems to have gone maverick in the Northern Hemisphere over the last few years. Take 2014 as an example. It’s on track to be the warmest globally in more than a century of record-keeping, with May, June, August, and September all setting world heat records for those particular months. Yet February only managed to tie for 21st warmest globally, mainly because of two regions of prolonged cold across North America and central Eurasia (see map at right).
As people who’ve endured some of the worst cold and snow in decades try to reconcile that experience with the picture of a warming planet, they’re also bracing for what 2014–15 might bring.
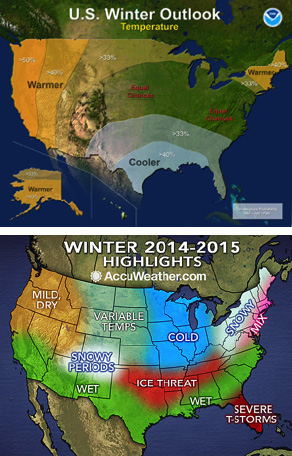
With a weak to perhaps moderate El Niño now expected to take shape, the U.S. winter outlook from NOAA calls for temperatures across the Midwest and Northeast to be near or above average, in line with what’s most common during El Niño events. However, AccuWeather is calling for recurrent bouts of cold and snow in roughly the same area. These outlooks aren’t directly comparable—for example, AccuWeather doesn’t specify whether the northeastern cold and snow would be worse than in an average winter — but the contrasting tones do suggest differences of opinion about what’s most likely to steer our upcoming winter.
Likewise, there’s major disagreement among scientists on exactly what might be causing the more general tendency toward colder winters in places like the central and eastern United States, Europe, and Russia. One factor is the Arctic, where depleted sea ice may be playing a role. Another is the tropical Pacific, where a tendency toward cooler-than-average sea-surface temperatures may also be involved.
The debate—one of the liveliest in weather and climate science today — is largely about which factor is most important.
The question of what’s put the chill on northern midlatitude winters is tightly linked to debate over the “global warming hiatus,” the widely publicized leveling of global temperatures that’s run from the late 1990s into the early 2010s. As we’ve noted before, multiple studies indicate that the world’s oceans have mopped up more heat than usual in this period and stored it at great depths, thus accounting for much of the hiatus. Scientists are still exploring which oceanic regions are most involved.

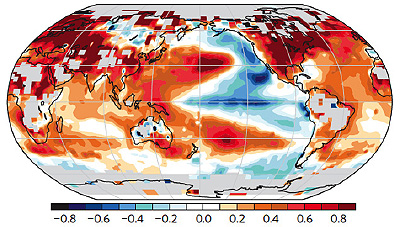
One fascinating aspect of the hiatus is that it’s been concentrated in the months of December through February (DJF) — the period known as meteorological winter in the Northern Hemisphere. This interval has seen a slight drop in global temperature since the late 1990s, while the other nine months have held fairly steady (see map at left).
“The strongest pause is in the northern winter,” said NCAR’s Kevin Trenberth, who recently analyzed seasonal aspects of the hiatus with three NCAR colleagues in the journal Nature Climate Change.
While places like Chicago, New York, Berlin, and Moscow have had a few severe winters lately, they’ve also had some very mild ones. A much larger, more sustained region of cooling lies across the central and eastern tropical Pacific Ocean, where El Niño and La Niña play out (see map below). As it happens, La Niña—the periodic cooling of surface water across the eastern tropical Pacific—has predominated over El Niño since the late 1990s. Both El Niño and La Niña events tend to be at their strongest in December-February.
La Niña events typically last just a year or two, but a similar pattern can persist across the North Pacific for periods of 20 or 30 years — then flip to an opposite mode, more akin to El Niño, for another 20-30 years. This is the Pacific Decadal Oscillation, and it appears to have worked in concert with specific La Niña events to reinforce the cooler-than-normal waters at the equatorial surface since around 1998.
During La Niña, stronger-than-usual trade winds keep warmer equatorial waters shunted toward the western Pacific. Such long-lasting rearrangements can goose the atmosphere into persistent responses that extend over a great distance. Modeling experiments carried out for the Trenberth et al. paper suggest that, especially in December-February, the unusually warm equatorial waters toward the western Pacific near the equator have led to a train of rising and sinking air pockets, called quasi-stationary Rossby waves. Analyzed at the jet-stream level (about 6 miles high), this wave train arcs northward into Alaska, eastward across the Canadian Arctic, then back south over the North Atlantic.
Trenberth and colleagues argue that the wave train they identified could be the main culprit disrupting the “polar vortex” (the band of high-altitude winds that normally encircles polar regions), thus allowing for more southward intrusions of Arctic air and poleward surges of mild air.
However, another prominent view is that the topsy-turvy pattern might be primarily caused not by the tropical ocean but by the Arctic itself. Some of the leading researchers in this camp include Jennifer Francis (Rutgers University), Judah Cohen (Atmospheric and Environmental Research, or AER), and James Overland (NOAA Pacific Marine Environmental Laboratory). The Arctic-as-driver viewpoint has gotten major play in media coverage over the last several years, and research on it continues to accumulate.
Keep reading … article continues at NCAR/UCAR AtmosNews.
Bob Henson posted the full article related to this excerpt on November 10, 2014 at NCAR/UCAR AtmosNews. UCAR is the University Corporation for Atmospheric Research, a consortium of more than 100 member colleges and universities focused on research and training in the atmospheric and related Earth system sciences. NCAR is the National Center for Atmospheric Research, which UCAR manages with sponsorship by the National Science Foundation, and which provides research, observing and computing facilities, and a variety of services for the atmospheric and related Earth sciences community. Excerpt used with permission.
Like what you read?
Subscribe and receive daily news delivered to your inbox.
More from
EarthSky Voices