


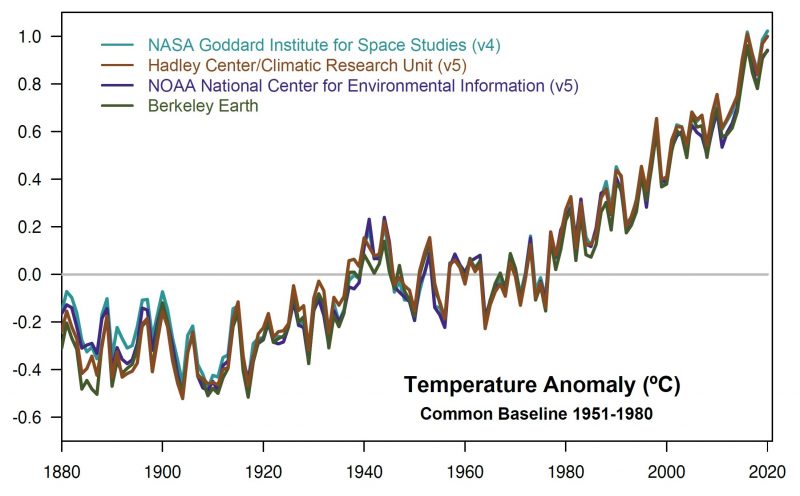
A NASA analysis, announced today (January 14, 2021), says that 2020 was Earth’s hottest year since modern record-keeping began 140 years ago, effectively tying 2016, the previous record-holder. A separate, independent analysis by NOAA concluded that 2020 was the second-warmest year in their record, just behind 2016.
Overall, Earth’s average temperature has risen more than 2 degrees Fahrenheit (1.1 degrees Celsius) since the 1880s. The world’s seven warmest years have all occurred since 2014, with 10 of the warmest years occurring since 2005.
Scientist say that temperatures are increasing due to human activities, specifically emissions of greenhouse gases, such as carbon dioxide and methane.
The year 2020 continued the planet’s long-term warming trend. According to NASA’s analysis, the year’s globally averaged temperature was 1.84 degrees Fahrenheit (1.02 degrees C) warmer than the baseline 1951-1980 mean, edging out 2016 by a very small amount – within the margin of error of the analysis – making the years effectively tied for the warmest year on record.
Gavin Schmidt is a climatologist, climate modeler and director of the NASA Goddard Institute for Space Studies. He said in a statement:
The last seven years have been the warmest seven years on record, typifying the ongoing and dramatic warming trend. Whether one year is a record or not is not really that important – the important things are long-term trends. With these trends, and as the human impact on the climate increases, we have to expect that records will continue to be broken.
Here’s more on 2020, from NASA:
While the long-term trend of warming continues, a variety of events and factors contribute to any particular year’s average temperature. Two separate events changed the amount of sunlight reaching the Earth’s surface. The Australian bush fires during the first half of the year burned 46 million acres of land, releasing smoke and other particles more than 18 miles high in the atmosphere, blocking sunlight and likely cooling the atmosphere slightly. In contrast, global shutdowns related to the ongoing coronavirus (Covid-19) pandemic reduced particulate air pollution in many areas, allowing more sunlight to reach the surface and producing a small but potentially significant warming effect. These shutdowns also appear to have reduced the amount of carbon dioxide (CO2) emissions last year, but overall CO2 concentrations continued to increase, and since warming is related to cumulative emissions, the overall amount of avoided warming will be minimal.
The largest source of year-to-year variability in global temperatures typically comes from the El Nino-Southern Oscillation (ENSO), a naturally occurring cycle of heat exchange between the ocean and atmosphere. While the year has ended in a negative (cool) phase of ENSO, it started in a slightly positive (warm) phase, which marginally increased the average overall temperature. The cooling influence from the negative phase is expected to have a larger influence on 2021 than 2020.
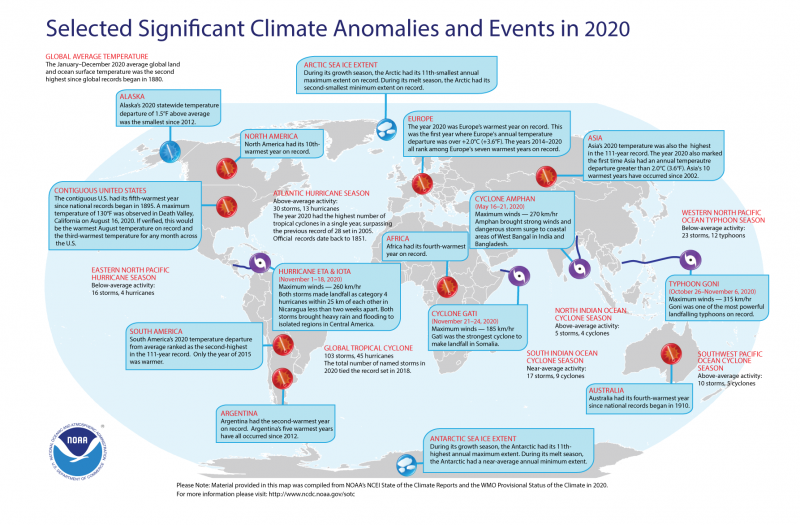
The 2020 analysis represents surface temperatures averaged over the whole globe and the entire year. Local weather plays a role in regional temperature variations, so not every region on Earth experiences similar amounts of warming even in a record year. But in the long term, scientists say some parts of the globe are warming faster than others. Earth’s warming trends are most pronounced in the Arctic, which is warming more than three times as fast as the rest of the globe over the past 30 years, according to Schmidt. The decline of Arctic sea ice – whose annual minimum area is declining by about 13% per decade – makes the region less reflective, Schmidt said, meaning more sunlight is absorbed by the oceans and temperatures rise further still. This phenomenon drives further sea ice loss, ice sheet melt and sea level rise, more intense Arctic fire seasons, and permafrost melt.
According to a NASA statement:
NASA and NOAA scientists use much of the same raw temperature data in their analysis, but have a different baseline period (1901-2000) and methodology. Unlike NASA, NOAA also does not infer temperatures in polar regions lacking observations, which accounts for much of the difference between NASA and NOAA records. Like all scientific data, these temperature findings contain a small amount of uncertainty – in this case, mainly due to changes in weather station locations and temperature measurement methods over time. The GISS temperature analysis (GISTEMP) is accurate to within 0.1 degrees Fahrenheit (.06 C) with a 95% confidence level for the most recent period.
NASA’s analysis incorporates surface temperature measurements from more than 26,000 weather stations and thousands of ship- and buoy-based observations of sea surface temperatures. These raw measurements are analyzed using an algorithm that considers the varied spacing of temperature stations around the globe and urban heating effects that could skew the conclusions if not taken into account. The result of these calculations is an estimate of the global average temperature difference from a baseline period of 1951 to 1980. You can see NASA’s full surface temperature data set and the complete methodology used to make the temperature calculation here.
Bottom line: 2020 tied with 2016 as the hottest year in the 140-year global climate record, according to NASA.
EarthSky 2021 lunar calendars now available! Order now. Going fast!
Like what you read?
Subscribe and receive daily news delivered to your inbox.
More from
Eleanor Imster


