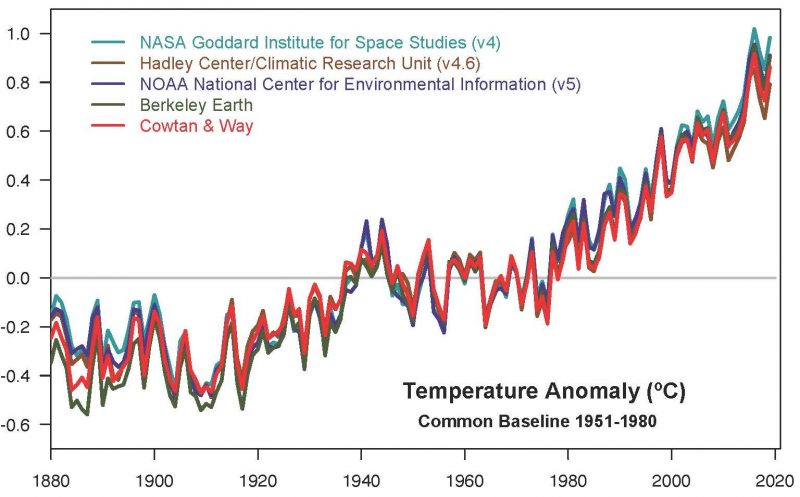
Earth’s long-term warming trend can be seen in this visualization of NASA’s global temperature record, which shows how the planet’s temperatures are changing over time, compared to a baseline average from 1951 to 1980. The record is shown as a running 5-year average.
According to independent analyses released yesterday (January 15, 2020) by both NASA and NOAA, Earth’s global surface temperatures in 2019 were the second warmest since modern record-keeping began in 1880.
Globally, 2019 temperatures were second only to those of 2016 and continued the planet’s long-term warming trend. The world’s five warmest years have all occurred since 2015, with nine of the 10 warmest years occurring since 2005, according to scientists from NOAA’s National Centers for Environmental Information (NCEI). The World Meteorological Organization also ranked 2019 second warmest for the globe, and scientists from the United Kingdom Met Office determined that 2019 was one of the top-three hottest years on record.
This past year, global temperatures were 1.8 degrees Fahrenheit (.98 degrees C) warmer than the 1951 to 1980 mean, according to scientists at NASA’s Goddard Institute for Space Studies (GISS) in New York. GISS Director Gavin Schmidt said in a statement:
The decade that just ended is clearly the warmest decade on record. Every decade since the 1960s clearly has been warmer than the one before.
According to reports by both agencies, the average global surface temperature has risen since the 1880s, and the average temperature is now more than 2 degrees Fahrenheit (a bit more than 1 degree C) above that of the late 19th century. For reference, the last Ice Age was about 10 degrees F (5.5 C) colder than pre-industrial temperatures.
According to NASA, scientists using climate models and statistical analysis of global temperature data have concluded that this increase mostly has been driven by increased emissions into the atmosphere of carbon dioxide and other greenhouse gases produced by human activities. Schmidt said:
We crossed over into more than 2 degrees Fahrenheit warming territory in 2015 and we are unlikely to go back. This shows that what’s happening is persistent, not a fluke due to some weather phenomenon: we know that the long-term trends are being driven by the increasing levels of greenhouse gases in the atmosphere.
You can see NASA’s full 2019 surface temperature data set and the complete methodology used for the temperature calculation and its uncertainties here.
Bottom line: According to analyses by both NASA and NOAA, Earth’s global surface temperatures in 2019 ranked 2nd-warmest since 1880.
Like what you read?
Subscribe and receive daily news delivered to your inbox.
More from
Eleanor Imster