By Park Williams, Columbia University
With each passing year, human-caused global warming bullies California for more water. Each year, the heat squeezes more moisture from soils and ecosystems.
This is because, as the atmosphere warms, its demand for moisture rises. Just as a puddle evaporates more quickly on a warm day, soils dry out more quickly during warmer years, which are becoming increasingly frequent in most locations globally.
Currently, California is in the grips of a severe drought, which motivated my colleagues and me to conduct a study to determine how much of this drought can be blamed on natural climate variability. And how much can be blamed on the global warming shakedown? Our answer is 8%-27%.
This finding, done using a model built on historical data, sheds light on California’s future and the effect higher temperatures have on the natural forces that drive California’s droughts.
California of buckets
Global warming is an emerging background effect on the year-to-year variations in drought caused by natural climate variations, such as El Niño and La Niña. This is especially true in California, where year-to-year precipitation varies wildly.
During most years, when natural climate variations cause wet or near-average conditions, the demands of the increasingly greedy atmosphere are still met with relative ease. During the last few years, however, natural climate variations have caused precipitation totals to be low and temperatures to be high. Human-caused warming, meanwhile, demands additional atmospheric moisture, at a time when water resources for natural and human systems are already in short supply.
Unlike natural climate variation, which only sometimes produces extreme conditions, the amount of additional moisture demanded by the atmosphere due to global warming increases each year as the concentration of atmospheric carbon dioxide rises ever higher. The squeeze that global warming is putting on California’s water balance is therefore becoming increasingly detectable.
My colleagues and I quantified the effect of global warming on the recent California drought using a computational soil-moisture accounting approach. In this approach, we treat California as if it is a grid of 24,000 buckets laid side by side, each about seven square miles in area, and we simulate monthly changes in the amount of water held in each bucket from 1901 through 2014.
Precipitation causes the buckets to fill up and potentially overflow, and evaporation causes the buckets to empty out. We calculated the evaporation from monthly records of temperature, humidity, wind speed and net radiation. Annual changes in the water content of the buckets during the summer months indicate annual changes in California water balance and can therefore be evaluated to determine the severity of the current California drought.
Dry weather versus higher temps
Because these drought calculations are all done mathematically using historical climate data, we can repeat our calculations over and over again while holding certain variables constant. This method allows us to isolate the relative contributions of specific climate processes, such as a lack of precipitation or the occurrence of extreme heat to the current California drought.
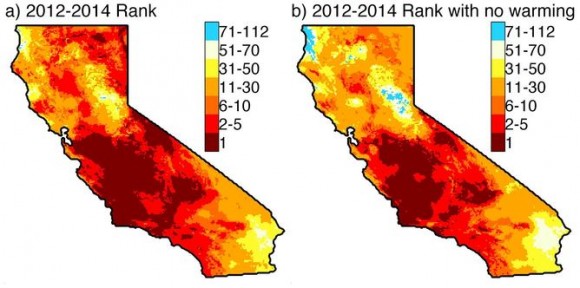
Performing these calculations, we find that about 70% of the California drought severity during 2012-2014 was attributable to a lack of precipitation, and the other 30% is attributable to increased atmospheric evaporative demand, which was mainly driven by very warm temperatures.

We next calculated how much of this temperature effect on drought was due to human-caused global warming and how much was due to natural temperature variability. We determined this by repeating our calculations using temperature records that exclude year-to-year temperature variations and only contain the long-term warming trend.
We found that one-half to two-thirds of the temperature influence on drought conditions during 2012-2014 can be blamed on the warming trend, depending on the climate datasets considered. In other words, in the absence of global warming, the recent drought would have been approximately 15%-20% less severe.
Running the numbers
It is important to acknowledge that we cannot be positive what portion of the long-term warming trend in California is related to human-caused global warming versus natural climate variability, so there is a fairly wide range of uncertainty surrounding the 15%-20% estimate.

For example, has the effect of global warming on the California drought been steadily rising each year? Or has the effect increased in recent decades due to accelerating greenhouse gas concentrations? Or did regulations to remove air pollutants in the latter half of the 20th century affect the warming rate due to increasing greenhouse gases?
To address this uncertainty, we considered four alternate long-term warming trends, derived from actual temperature measurements and from temperature records simulated by climate models. Collectively, these warming scenarios are very likely to encompass the full range of possibilities. Considering the range of warming trends and all combinations of climate data sets used in this study, we concluded that global warming contributed between 8% and 27% to the severity of 2012-2014 California drought.
Natural variability still dominant
This result means that global warming is already having an important impact on California drought, but also that natural climate variability is still dominant.
During 2012-2014, naturally low precipitation totals and high temperatures were mainly caused by a persistent high pressure system off the US West Coast that blocked storms from making landfall in California. Combined with the increased evaporative demand due to global warming, this naturally occurring drought event produced record, or near record, drought throughout much of California.
While there have been other three-year periods in the past when statewide drought severity has been similar to that observed in 2012-2014, drought conditions during 2012-2014 have received much more attention than previous droughts partly because of where the most intense conditions were focused. Record-breaking drought conditions occurred in California’s Central Valley, which is important for agriculture, the southern Sierra Nevada Mountains, which is important for human water resources, and the southern and central coastal areas, which is where a large proportion of the population resides.
Given that natural climate variability still dictates when the dry and wet periods occur in California, it is highly likely that wet conditions will return to the state in the next few years.
Also because of natural climate variability, drought conditions are sure to return again and again, and each time the atmospheric bully and its high temperatures will demand an extra moisture payment, increasingly enhancing the likelihood of severe droughts with increasing duration. If California finds itself struggling with this drought, serious planning needs to take place in order to be resilient to a future where it’s increasingly likely that the current drought will look like child’s play.
![]()
Park Williams is Assistant Research Professor of Bioclimatology at Columbia University
This article was originally published on The Conversation. Read the original article.
Like what you read?
Subscribe and receive daily news delivered to your inbox.
More from
EarthSky Voices