Satellite researcher Alan Belward works for the Institute for Environment and Sustainability, part of the European Commission’s Joint Research Center in Ispra, Italy. Dr. Belward heads the Land Resource Management Unit, which looks at changes to land cover and land use on a global scale. In 2011, Dr. Belward was part of the most comprehensive forest survey ever, which involved 190 countries. An essential tool for his research is data from the Landsat satellite program, which has taken detailed pictures of forest canopies for over 40 years. Dr. Belward spoke with EarthSky’s Jorge Salazar about tracking Earth’s forests from space.
Dr. Belward, you are the Head of the Land Resource Management Unit within the Institute for Environment and Sustainability at the European Commission’s Joint Research Center in Italy. Tell us about what you do.
The Land Resource Management Unit is one of eight scientific units. A unit is a group of scientists all working on a common theme. There are about 1,400 of us full-time here at this research center in northern Italy. We provide scientific evidence for European policy-making on issues like climate change, global development, and sustainable development programs. Our policy makers have an increasing demand for science-based evidence to support their work. One of our jobs is to provide that evidence.
In the land resource management area, the basic fact is that natural resources, like forests and land to grow crops, are getting more and more scarce. There’s a lot more pressure on them. There’s a lot of competition now. Do you use a forest as a carbon sink? Do you use it as a protected area for biodiversity? Or do you use it for fuel wood? There are all sorts of competing demands on our resources. To make sensible decisions on trade-offs between different uses, you need evidence on where these resources are, what sort of condition they’re in, and how they’re changing.
Tell us about your involvement in the Global Forest Remote Sensing Survey for the U.N., which assessed how humans are changing forests on a global scale. What did you find, and how was it done?

This is something that the United Nations Food and Agriculture Organization has actually been doing since the 1940s. Every few years they produce this detailed report on the state of the world’s forests. For the last few years these reports rely on statistics provided by the different countries around the world. I think more than 190 countries give them statistics on where the forests are and how much forest there is and what they’re doing with it.

But for the last few years, they’ve also been running a remote sensing survey. They have been using satellite imagery as an independent assessment of the state of forest resources. We work with them as one of the partners on that survey.
What they found is that about 30 percent of the whole planet’s land area, starting in 2005, was covered in forest. And rather worryingly between 1990 and 2005, we’ve lost about 180 million acres of forest. That’s rather a lot.
These big numbers are quite scary. Most of us can picture what a football field looks like. Now, if you can imagine that all covered in forest, it takes something less than four seconds to lose that entire area of forest. We’re losing about a football field worth of forest every four seconds of every minute of every day. That’s net loss. That’s including all the new trees that have been planted around the world. When I say we’ve lost 180 million acres, that’s really gone. It’s not been replaced by new stuff.
It doesn’t matter what you’re doing or where you’re doing it, somewhere around the planet there’s a tree falling, and it’s fallen for good.
How is satellite data from Landsat used in the Global Forest Remote Sensing Survey?
Landsat is a global system. We’re looking at every point on the Earth’s surface with the same amount of detail, with the same scientific rigor. We’re making the same measurements. That’s extremely important, because it means when I make a statement about forest cover change around me here in northern Italy, or in the center of the African Congo basin, we’re using the same measurement, the same precision today.
What we’ve done with colleagues at the UN FAO is we’ve taken about 13,000 plots around the world which are distributed uniformly, every 60 miles or so, north, south, east, and west. We take a sample plot and we map the change in an area of about 25 acres. That is done 13,000 times in 1990, in 2000, and in 2005. The other delightful thing about Landsat is, because it’s up there in orbit, it comes back time after time, so that we can look at this change over time. We can keep going back to the same 13,000 points and find out what’s happened.
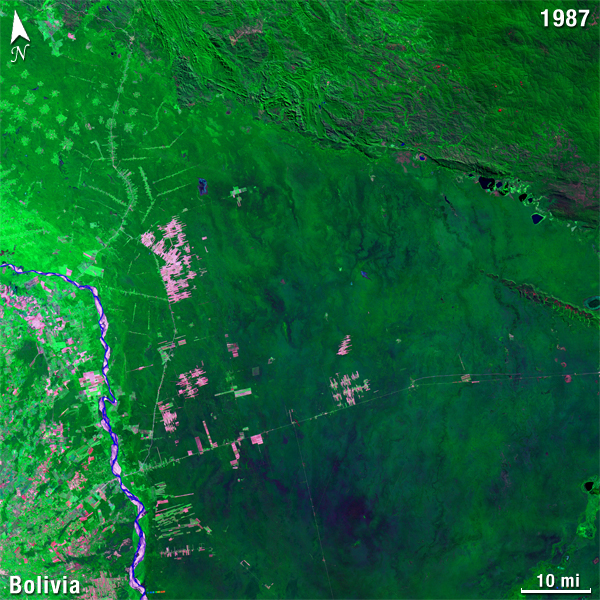
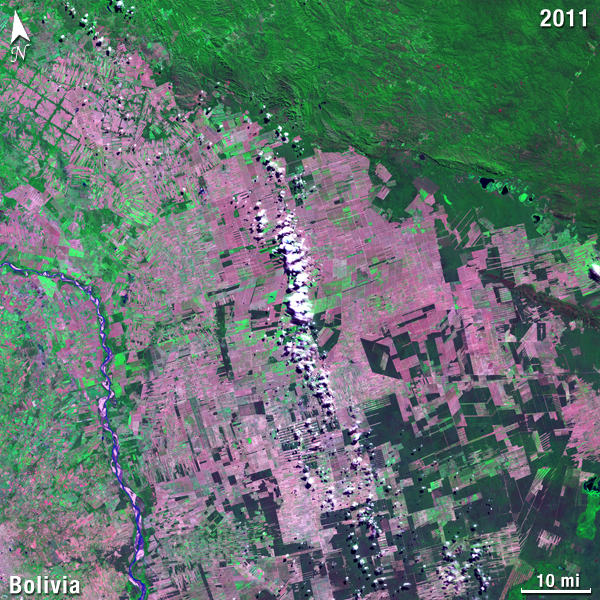
Landsat provides us with a really quite detailed picture of the forest canopy. It’s not just a photograph. It’s actually measuring light outside the range of sensitivity to the human eye. So it’s giving us extra information than a normal photograph. We’re able to pick up subtle changes in the forest canopy. You can see where you’ve got largely undisturbed forests or where a logging road has gone in or where it’s been clear felled to convert it to other lands.
It depends where you are in the world as to what the main driver of deforestation is. In some parts of the world it’s clearing land to grow new crops. In other parts of the world it’s getting rid of the forest so you can convert it into ranch land for cattle. Elsewhere, it’s to make room for new forest so you can put in timber for oil palm.
How important is Landsat in monitoring how humans are changing forests worldwide?
I have to say Landsat is an absolutely unique tool for us. I think it’s unique for three reasons, really.
One is the longevity of the program. Where else can we get a chance to look back at part of the world for 40 years? We can go back to 1972 for various points on the planet’s surface and look at how that forest has changed. Longevity is a dramatic factor. It’s the definitive source. It’s the only way we can go back that far in time consistently around the planet.
The second point is its consistency around the planet. It’s global. Right from the beginning, the people managing the Landsat program have gone out of their way to make sure that there’s imagery from different parts of the world. We’ve not just concentrated with the U.S., for example. We’ve looked everywhere.
The final real bonus is over the last few years, our data archive was opened up for free and open access.
Those three factors, the longevity, the global data acquisition program and the free and open data access, really it is a wonderfully valuable resource for forest monitoring.
Scientists have told EarthSky that deforestation, happening mainly in developing countries, is a big part of the carbon emissions that cause climate change. How useful is Landsat data to the international community concerned with climate?
It’s a fundamental part of the scientific armory in information gathering. With Landsat, we’ve got the opportunity to make consistent measurements on forest cover change. When we talk about deforestation accounting for 12 percent of all anthropogenic emissions, it’s something like 1.2 pentagrams of carbon a year emitted from deforestation — big scary numbers. The big issue is the uncertainty. The general estimates of deforestation could be off by 40 or 50 percent, based on all the different estimates that are made on the ground. The remote sensing survey is allowing us to stand back a bit, look at the whole planet consistently and make some of the most robust sets of measurements. Gradually over the years, we’re getting more and more precise understanding of what these rates of deforestation are. That’s the first thing.
The second thing is that it’s actually quickly moving to the point where it will provide us with very detailed maps of not just the statistics of the change, but actual maps of where these forests lie. The very first map of global land cover from Landsat is pretty much underway at the moment, with the Chinese actually running that one. This is beginning to become available to the scientific community. That will feed into a lot of climate models, because you need to know whether you’re dealing with a big, dark, wet, carbon-absorbing forest or a bright dry reflective desert. We’re getting very detailed maps now from Landsat and that all important measure of change.
Our thanks today to the NASA and USGS Landsat Program, creating an unparalleled record of Earth’s changing landscapes.
Listen to the 8-minute and 90-second EarthSky interviews with Alan Belward on tracking changes to Earth’s forests from space, at the top of the page.


