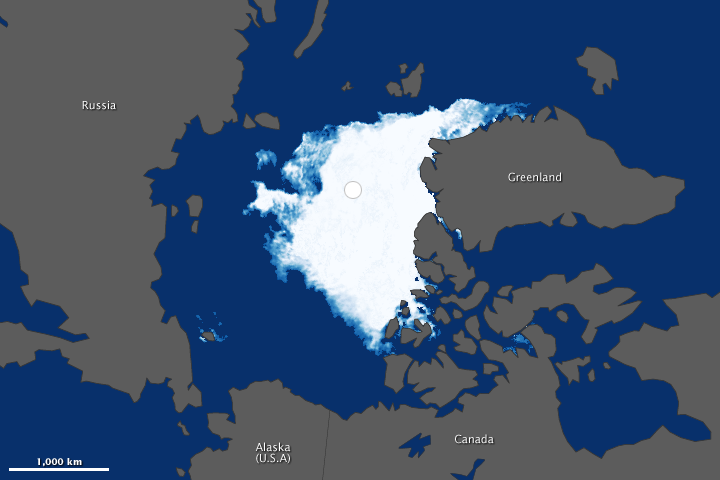
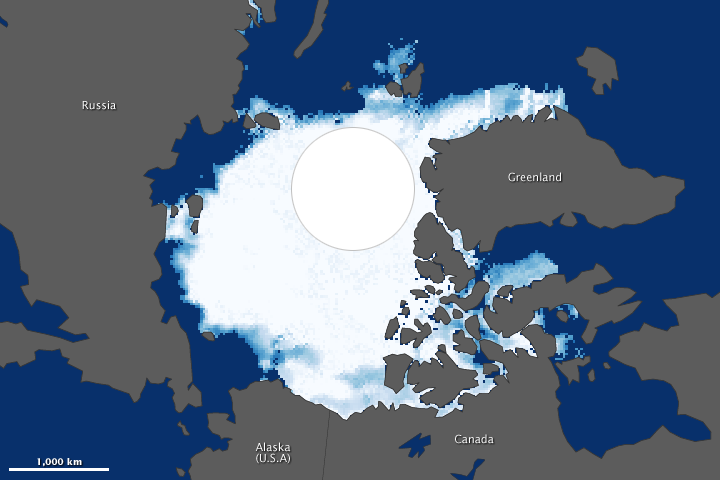
These two maps, created from satellite data, compare the Arctic ice minimum extents in 2012 and 1984.
Arctic sea ice grows through the winter each year and melts through the summer, typically reaching its minimum extent – lowest amount – sometime in September. The extent can vary considerably from year to year, but in August and September 2012, sea ice covered less of the Arctic Ocean than at any other time since at least 1979, when the first reliable satellite measurements began.


The white circle over the pole in each image is a data gap resulting from satellites flying close to — but not directly over — the poles. The wider orbital coverage by newer satellite instruments has shrunk the size of this gap. The area around the North Pole is ice-covered —an assumption confirmed by many airborne and ice-surface expeditions—but researchers use an average of the concentration just outside the gap to estimate the extent within.
The National Snow and Ice Data Center (NSIDC) and NASA announced in mid-September that the extent of Arctic sea ice had dropped to 3.41 million square kilometers (1.32 million square miles) — well below the previous record of 4.17 million square kilometers (1.61 million square miles) set in 2007.
According to NSIDC, the average minimum extent for 1979–2000 was 6.70 million square kilometers (2.59 million square miles). The 1984 minimum was roughly that amount, so a comparison between 2012 and 1984 gives an idea of how much conditions this year strayed from the long-term average. The minimum ice extent in 2012 was about half the average.
The summer of 2012 witnessed periods of extremely rapid sea ice melt. NSIDC scientist Walt Meier explained:
In June, sea ice lost about 170,000 to 175,000 square kilometers per day, but only for a few days. Sea ice melt usually slows down in August to about 60,000 to 70,000 square kilometers a day. But this year, we saw melt rates upwards of 100,000 to 150,000 square kilometers a day, and those high melt rates persisted through the first half of the month.
Once sea ice begins to melt, it becomes a self-reinforcing process. Because there is less ice to reflect sunlight back into space, more energy is absorbed by the darker ocean water. As sea ice extents drop, less ice survives from year to year. Ice that has formed since the last melt season—“known as first-year ice”—is thinner and more prone to melting than thicker multi-year ice. In the past decade, first-year ice has come to dominate the Arctic Ocean.
According to Comiso, the rapid loss of sea ice through June 2012 was likely associated with the loss of this first-year ice, which was unusually extensive in March 2012. The rapid decline in August 2012, he noted, was caused in part by a strong storm that stirred up the region, breaking ice apart and moving more of it to lower latitudes.
Claire Parkinson, a climate researcher at NASA Goddard, said:
Climate models have predicted a retreat of the Arctic sea ice; but the actual retreat has proven to be much more rapid than the predictions. There continues to be considerable inter-annual variability in the sea ice cover, but the long-term retreat is quite apparent.
Bottom line: Images created from satellite data in 2012 and in 1984 illustrate the decrease in Arctic Sea ice in September.


