The animation above shows a new 3-D rendering of space dust, as viewed in a several-thousand-light-year loop through and out of the flat plane of our Milky Way galaxy. It’s part of a new study by scientists at Berkeley Lab, published March 22, 2017 in the peer-reviewed Astrophysical Journal. Why a study of space dust? For one thing, as these study authors explained in a statement:
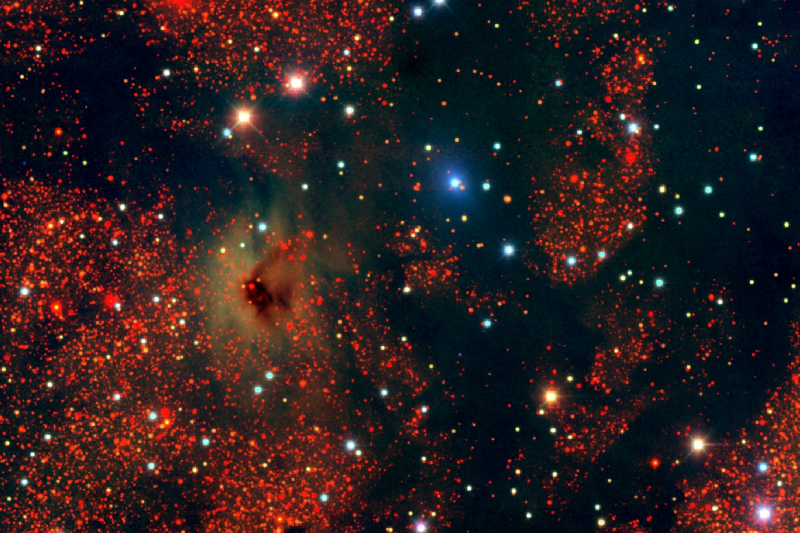
Consider that the Earth is just a giant cosmic dust bunny — a big bundle of debris amassed from exploded stars. We Earthlings are essentially just little clumps of stardust, too, albeit with very complex chemistry.
So space dust has intrinsic interest. However, the clouds of space dust in our Milky Way galaxy can also be problematic for astronomers. Dust can dim, or obscure, the light of stars and galaxies beyond. Lead author of the new study is Edward F. Schlafly, a Hubble Fellow at Berkeley Lab. He explained:
The light from … distant galaxies travels for billions of years before we see it, but in the last thousand years of its journey toward us a few percent of that light is absorbed and scattered by dust in our own galaxy.
We need to correct for that.
The correction is particularly important to scientists at Berkeley Lab. They’re designing a future project, called the Dark Energy Spectroscopic Instrument (DESI) that’ll work to measure the universe’s accelerating expansion rate after it launches in 2019.
DESI will build a map of more than 30 million distant galaxies, but that map will be distorted if this dust is ignored. And so, Schlafly said:
The overarching aim of this project is to map dust in three dimensions — to find out how much dust is in any 3-D region in the sky and in the Milky Way galaxy.
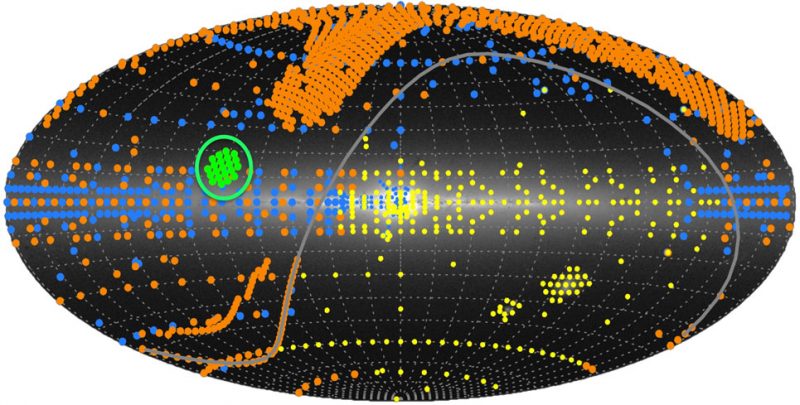
Taking data from separate sky surveys conducted with telescopes on Maui and in New Mexico, Schlafly’s research team has already composed maps that compare dust within one kiloparsec – or 3,262 light-years – in the outer Milky Way. They used data from the Pan-STARRS sky survey in Hawaii, and from a separate survey called APOGEE at Apache Point, New Mexico, which used a technique called infrared spectroscopy. Infrared observations let astronomers peer through dust. As these scientists’ statement said:
Infrared measurements can effectively cut through the dust that obscures many other types of observations … The APOGEE experiment focused on the light from about 100,000 red giant stars across the Milky Way, including those in its central halo.
Schlafly said 3-D dust maps they now have in hand have a much greater resolution (ability to see details) than anything that previously existed.
And of course, as always happens, they found is a more complex picture of dust than earlier research and models had suggested.

The results, researchers found, appear to be in conflict with models that expect dust in the Milky Way to be more predictably distributed, and to simply exhibit larger grain sizes in areas where more dust resides. The observations find that the dust properties vary little with the amount of dust, so existing models of dust in the Milky Way might need adjustment to account for a different chemical makeup, for example. Schlafly said:
In denser regions, it was thought that dust grains will conglomerate, so you have more big grains and fewer small grains.
But the observations show that dense dust clouds look much the same as less concentrated dust clouds, so that variations in dust properties are not just a product of dust density, he said, and:
… whatever is driving this is not just conglomeration in these regions.
Schlafly also said that, even with a growing collection of dust data, we still have an incomplete dust map of our galaxy:
There is about one-third of the galaxy that’s missing, and we’re working right now on imaging this ‘missing third’ of the galaxy.
A sky survey that will complete the imaging of the southern galactic plane and provide this missing data should wrap up in May, he said.
APOGEE-2, a follow-up survey to APOGEE, for example, will provide more complete maps of the dust in the local galaxy, and other instruments are expected to provide better dust maps for nearby galaxies, too.
Bottom line: Astronomers have been surveying the dust in our Milky Way galaxy in three dimensions. They’re doing this in part for dust’s intrinsic interest, and also because they want to understand how collections of dust in the Milky Way dims or obscures the light of stars and galaxies beyond.
Like what you read?
Subscribe and receive daily news delivered to your inbox.
More from
Deborah Byrd