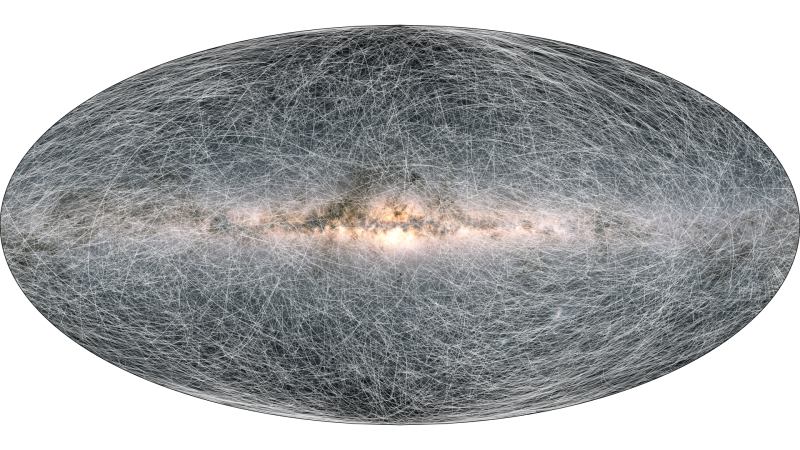
Astronomers have released the third set of data (EDR3) from the wonderful Gaia space observatory, the European Space Agency (ESA) reported on December 3, 2020.
Initial results are presented in four new “demonstration papers” (see the bottom of this post for links), listed as Performance Verification Papers, as well as other related papers and data.
The findings in the demonstration papers focus largely on stars in an interesting direction of space, the direction toward the outskirts of our Milky Way galaxy. There is a point in that direction known as the the galaxy’s anticenter; it happens to be located near the star Elnath in the direction of the constellation Taurus the Bull.
The anticenter is in the exact opposite direction from the center of our galaxy, as seen from Earth. That’s partly where Gaia looked for its third set of data.
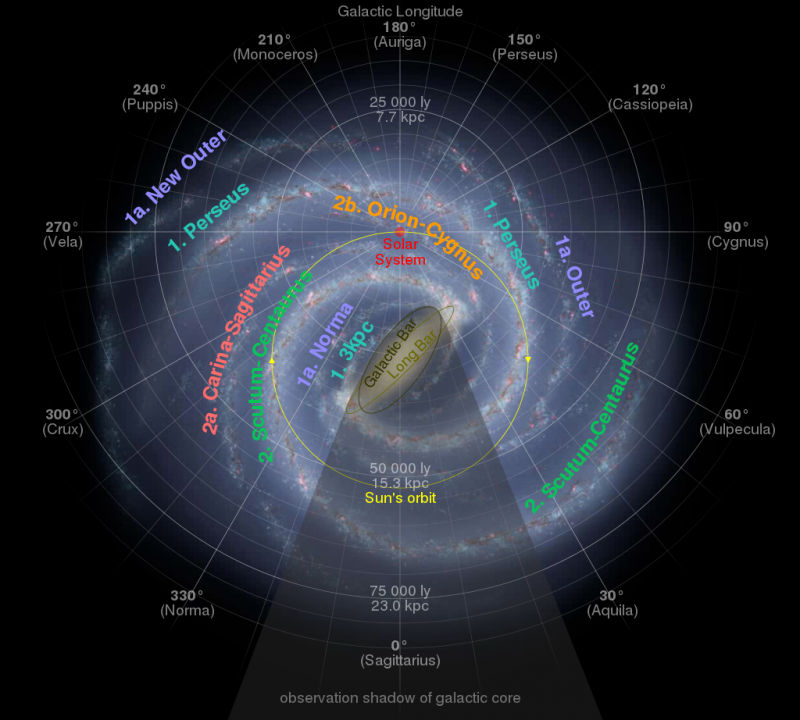
Read more: Which spiral arm of the galaxy contains our sun?
The 2021 lunar calendars are here! Order yours before they’re gone. Makes a great gift!
If Gaia’s first and second data releases are any indication, the analysis of this data – by astronomers in the years ahead – will provide some of the most interesting insights available about our own Milky Way galaxy.
Gaia is charged with creating a 3D map of the galaxy. Knowing exactly where stars are – and how they’re moving – is already providing new details about our Milky Way galaxy’s past, and indicates significant changes during its evolution.
Other papers reveal more details about the census of nearby stars, derive the shape of the solar system’s orbit around the center of the galaxy, and probe structures in two other nearby galaxies.
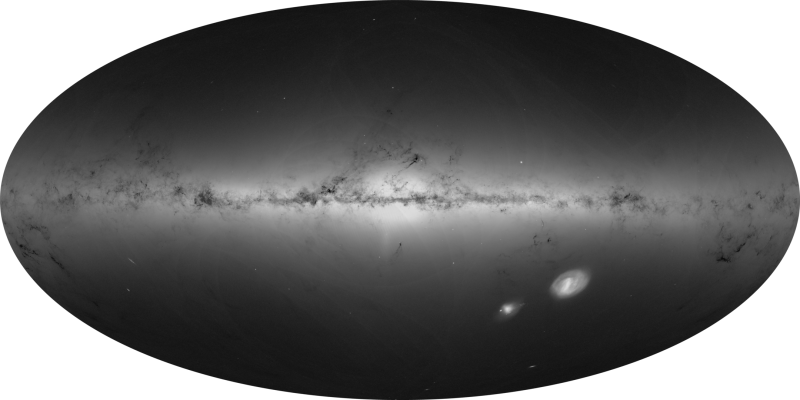
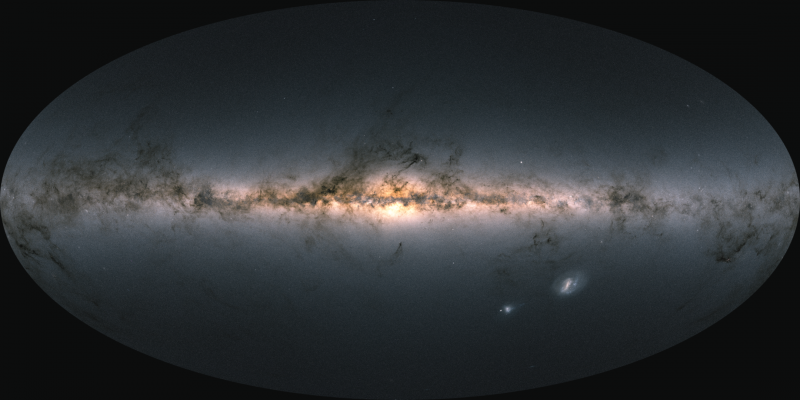
The data in EDR3 is extensive, with more than 1.8 billion sources that the Gaia spacecraft detected. That’s 100 million sources more than the previous data release (EDR2), from April 2018, which contained 1.7 billion stars. Indeed, according to Jos de Bruijne, ESA’s Gaia Deputy Project Scientist:
The new Gaia data promise to be a treasure trove for astronomers.
The new release also contains color information for about 1.5 billion sources, 200 million more than in EDR2. The general accuracy and precision of the measurements has also significantly improved from the previous release. EDR3 includes:
– 1,811,709,771 sources with positions to provide the best ever sky maps
– 1,467,744,818 sources with parallax and proper motion to reveal their distances and motions
– 1,806,254,432 sources with the measurement of their brightness in white light
– 1,542,033,472 sources with the brightness of the objects in blue light
– 1,554,997,939 sources with the brightness of the objects in red light (a comparison of the blue and the red light provides information of the temperature of the object)
– 1,614,173 extragalactic sources to provide a reference frame for measuring ‘absolute’ positions and motions
The data release came with the following very wonderful videos, perfect for all who to think big. This first one (below) is an animation showing the proper motions of 40,000 stars, all located within 100 parsecs (326 light-years) of our solar system. “Proper motion” is a star’s motion across the sky. It’s imperceptible to the eye, but it’s precisely what Gaia is measuring. Read more about the animation here.
This next animation – also from Gaia’s 3rd data release – shows the acceleration of our solar system around the center of the Milky Way. ESA explained:
With the high quality of Gaia EDR3, Gaia is for the first time capable of observing the tiny effect of the acceleration of the solar system with respect to the distant universe. This tiny effect is not measured directly but deduced from the aberration of light seen in 1.6 million quasars observed by Gaia. These quasars are extragalactic sources at extremely large distances and are used to generate an inertial reference frame …
View the video below, and read more about the acceleration of the solar system.
The next video shows the movement of almost 75,000 stars from the Gaia Catalogue of Nearby Stars in their orbits around the center of the galaxy. Their motions for the next 500 million years are shown from 3 different perspectives (face-on, side view, and perspective). Each second on the video corresponds to six million years, and the field of view for each image of the galaxy is 100,000 light-years wide. Read more about the video here.
Gaia uses astrometry to scan the sky repeatedly, observing each of its targeted stars an average of 70 times over its planned five-year mission.
Why is all of this important? With new and improved data, scientists can better understand how our galaxy originated and developed over billions of years. There are several specific results in particular.
First, astronomers can now track the various populations of older and younger stars out toward the very edge of our galaxy. The Milky Way was once much smaller than it is now, and the new data shows the relics of the former galactic disk as it looked 10 billion years ago. The galaxy will also continue to grow larger as new stars are born.
There is also evidence for slow-moving stars that are above the galactic plane of the galaxy, but are moving downward toward it, as well as fast-moving stars below it that are heading upward. The scientists say this may be the result of a near-collision between our galaxy and the nearby satellite Sagittarius Dwarf Spheroidal Galaxy in the relatively recent past, cosmologically-speaking. The Sagittarius galaxy is gradually being “eaten” or cannibalized by the Milky Way, which is much larger. Even a near-collision would have perturbed the motions of some stars in our galaxy.
Data from EDR2 had indicated that this close pass occurred about 300 to 900 million years ago. The results from EDR3 now show how strong the effects of it were on our galaxy. Teresa Antoja at the University of Barcelona, Spain, said:
The patterns of movement in the disk stars are different from what we used to believe.
How much of an effect the Sagittarius galaxy actually had is still debated, but according to Antoja:
It could be a good candidate for all these disturbances, as some simulations from other authors show.
Some of the new results are much closer to home. Another of the four papers measures the acceleration of our solar system with respect to the rest of the universe. The velocity has increased by 0.23 nanometers/second, every second. This means that the trajectory our solar system is traveling on is being deflected by the diameter of an atom every second. That works out to 115 km (71 miles) per year. According to the scientists, this is in good agreement with previous theoretical expectations. This is also the first-ever measurement of the curvature of the solar system’s orbit.
Another paper provides a new census of the number of stars in our sun’s solar neighborhood. The previous census, the Gliese Catalogue of Nearby Stars in 1957, included just 915 objects initially, but was later updated in 1991 to 3803 celestial objects. The new census contains a whopping 331,312 objects, estimated to be 92% of the stars within 100 parsecs (326 light-years) of the sun. The census in 1957 was limited to a distance of 82 light-years, but the new one is four times that, with 100 times more stars. The new data is also more accurate in terms of location, motion and brightness of the stars.
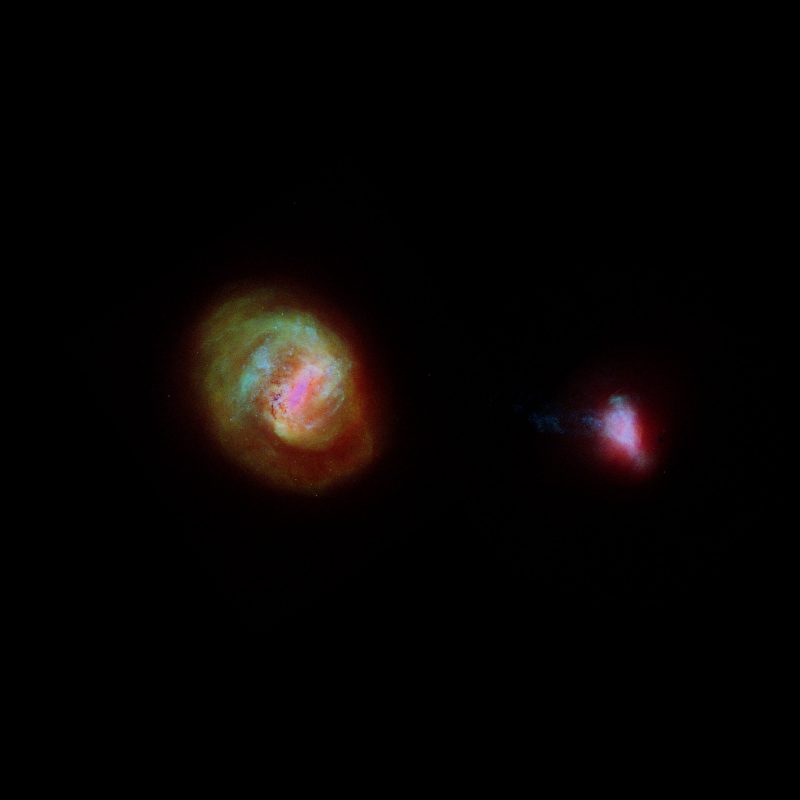
The EDR3 release also looks beyond the Milky Way itself, with the movement of the Large Magellanic Cloud‘s stars – a smaller satellite galaxy of our our Milky Way – measured more accurately than ever before. The new data shows that the LMC has a spiral structure, like the Milky Way does. In the Small Magellanic Cloud, a previously unseen stream of stars being pulled out of it was also found.
There’s more to look forward to as well; this EDR3 data release is just the first of two parts. The full release is scheduled to happen sometime in 2022. As Timo Prusti, ESA’s Gaia Project Scientist, said:
Gaia EDR3 is the result of a huge effort from everyone involved in the Gaia mission. It’s an extraordinarily rich data set, and I look forward to the many discoveries that astronomers from around the world will make with this resource. And we’re not done yet; more great data will follow as Gaia continues to make measurements from orbit.
You can also read a handy, condensed “by the numbers” report about the new discoveries, as well as previous extensive EarthSky coverage of science from Gaia over the past several years.

Gaia was launched in 2013 and began science operations the next year. Its mission is expected to continue until 2022. View a map showing the locations of members of the Gaia Data Processing and Analysis Consortium (DPAC) across Europe.
This third data release is a major step in learning more about our galaxy and its neighbors, and how it has changed over billions of years and continues to evolve now. What will the upcoming second part of EDR3 reveal?
Bottom line: The 3rd data release from the Gaia mission will provide astronomers with a “treasure trove” of information they didn’t have before. As they analyze Gaia’s data in the years ahead, we’re sure to learn new and surprising things about our home galaxy, the Milky Way.
Source: Gaia Early Data Release 3: The Gaia Catalogue of Nearby Stars
Source: Gaia Early Data Release 3: Structure and properties of the Magellanic Clouds
Source: Gaia Early Data Release 3: The Galactic anticentre
Source: Gaia Early Data Release 3: Acceleration of the solar system from Gaia astrometry
Via Gaia’s Early Data Release 3 in numbers
Like what you read?
Subscribe and receive daily news delivered to your inbox.
More from
Paul Scott Anderson