


By Rebecca Lindsey, Michon Scott, via NOAA Climate.gov
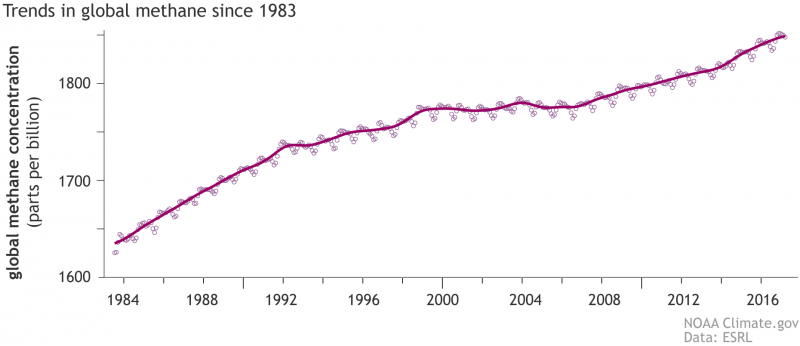
When it comes to global warming, carbon dioxide is the 800-pound gorilla: it’s the most abundant of the long-lived greenhouse gases that human activities generate. But ounce for ounce, methane (CH4) traps more heat, and it accounts for about 20% of the greenhouse gases produced by human activities. Strangely, though, global methane levels “flat lined” from 1999 to 2006.
The plateau didn’t last, however, and in recent years, global methane levels have been hitting new highs. Figuring out what’s going on with methane is a high priority for carbon cycle experts at NOAA and other institutions around the world. Possibly the most important clue: air samples collected at different latitudes around the world show that the amount of methane carrying carbon-13—a rare, heavy isotope of carbon—has dropped significantly since 2007.
That drop casts doubt on one of the first explanations experts considered for the post-2007 rise: an increase in methane emitted from fossil fuels, including “fugitive” methane gas escaping during oil and natural gas drilling. Instead, the chemical fingerprints point toward agricultural and wetland emissions from the tropics.
A methane bomb…or not
Scientists have long recognized the possibility—small, but not zero—that global warming could ignite a “methane bomb” in the Arctic: the rapid release of huge amounts of methane from thawing permafrost and underwater methane hydrates. Such a release could trigger extinction-level warming.
Even without a catastrophic Arctic release, methane matters. It has a shorter lifetime than carbon dioxide but a larger global warming potential, which means controlling methane could help reduce warming over the next 20-30 years. In that context, the 1999-2006 plateau was a step in the right direction. The 2007 resurgence, a step back.
Ed Dlugokencky is a research chemist with NOAA’s Earth System Research Center. Dlugokencky said:
The region most sensitive to increased methane emissions from climate change is the Arctic.
Deep layers of peat, frozen in winter and waterlogged through short summers, are full of anaerobic microbes that “exhale” methane rather than carbon dioxide. As permafrost thaws, microbial activity is increasing.
But while Arctic methane concentrations spiked in 2007, Dlugokencky said:
We don’t yet have evidence that the rate of Arctic methane emissions is rising over the long term.
In fact, recent research from NOAA and others shows that as Arctic tundra thaws, it’s releasing increasing amounts of carbon dioxide, not methane. (Arctic lakes may be a different story.)
Other suspects
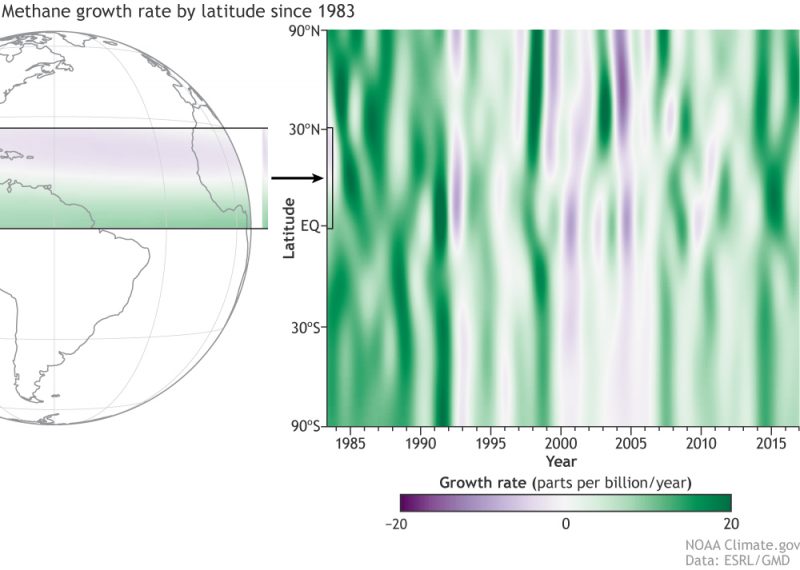
NOAA has been measuring atmospheric methane concentrations in air samples from locations around the world since the early 1980s, so scientists have a pretty clear picture of methane growth rates at different latitudes over recent decades. The seasonal and geographic patterns are helping scientists puzzle out what’s going on.
University of Alaska Fairbanks Professor Katey Walter Anthony takes us onto a frozen lake in Fairbanks, AK to demonstrate why methane gas has “exploded” onto the climate change scene.
Declines in the late 1990s through the mid-2000s are concentrated in the Northern Hemisphere. The leading hypothesis is that industrialized countries, including the United States, got better control of “fugitive” methane emissions, which escape during drilling and pumping of oil and natural gas.
The hunt for an explanation is complicated by the fact that experts aren’t even 100% sure that the atmospheric lifetime of methane is constant. The lifetime of a methane molecule released into the air is mostly controlled by reactions with the atmosphere’s primary oxidizing agent: the hydroxyl radical (OH). Dlugokencky said:
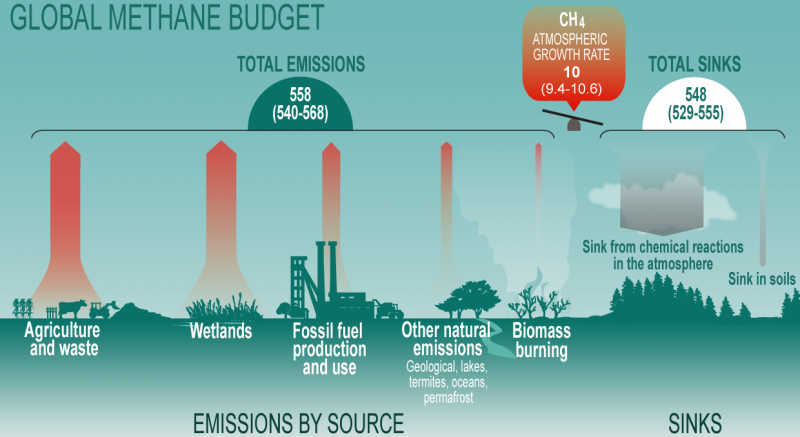
If you assume the methane lifetime is constant, no changes in emissions are necessary [to explain] the plateau; it’s just the natural adjustment of a system trying to get into equilibrium.
In other words, sinks that remove methane catching up with sources.
The trouble is, experts haven’t completely ruled out the possibility that methane’s lifetime isn’t constant. Hydroxyl radical isn’t something we can measure directly at a global scale. So there remains a possibility that the abundance of hydroxyl radical varies enough over time and place to play some kind of role in the stop and go trajectory of methane levels in recent decades. Dlugokencky said.
Not accurately knowing the lifetime increases uncertainty on global emissions.
Ruling things out
The post-2007 uptick in global methane levels roughly coincides with the rapid deployment of natural gas “fracking” in the United States, making fugitive emissions a logical suspect. But attempts to verify the connection have produced counter-intuitive results, according to Stefan Schwietzke, a methane expert from the Cooperative Institute for Research in Environmental Sciences (a NOAA-University of Colorado Boulder partnership).
Schwietzke’s research suggests that methane emissions from fossil fuels are higher than countries’ self-reported inventories suggest, and they may even be increasing. And yet, he explained via email, methane derived from fossil fuels is enriched with carbon-13—a rare, heavy isotope of carbon—and air samples show that the amount of carbon-13-flavored methane is dropping worldwide.
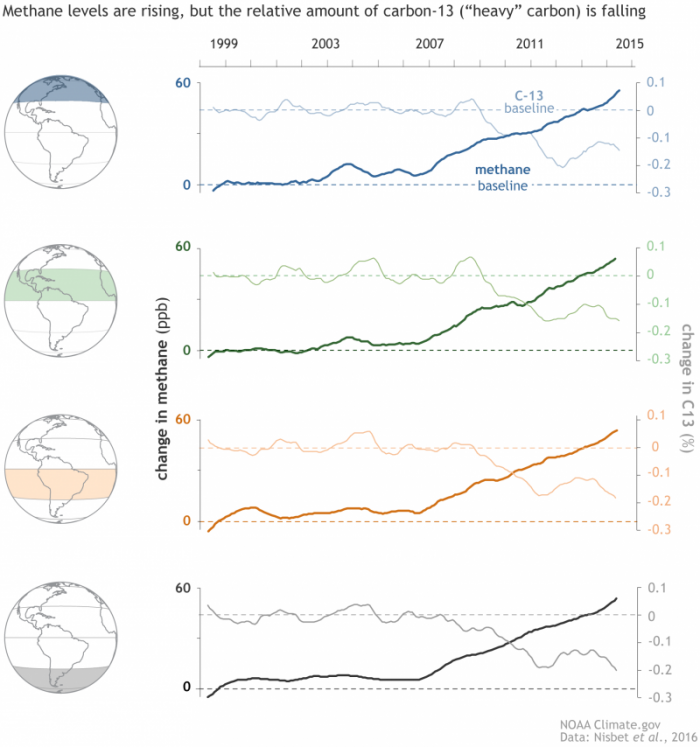
The drop seems to rule out fossil fuel emissions, wildfires, or biomass cook stoves as the reason for the post-2007 methane surge. All those sources of methane, to a greater or lesser extent, are enriched in carbon-13, not depleted.
It’s a counterintuitive finding: methane from fossil fuels is higher than we thought, but it seems to be making up a smaller share of total global emissions. In his email, Schwietzke wrote, “The decline in the 13-C isotope of methane in the atmosphere indicates that microbial sources must have an increasing share of total methane emissions globally.”
Nurture versus nature
The case for a biological, microbial source is strong, but it’s less clear exactly which source or sources it is. Based on the satellite data, says Dlugokencky,
…it seems like methane emissions are increasing most in the tropics and mid-latitudes of the Northern Hemisphere, and we have some ideas why, but no definite answers.
The carbon isotope analyses, carried out for NOAA by the Stable Isotope Laboratory at the University of Colorado Boulder’s Institute of Arctic and Alpine Research, are consistent with an increase in microbial emissions from both natural wetlands and agricultural sources.
Agricultural sources of methane include rice farming and belching from ruminant livestock. Rice farming depends on periodic flooding of growing areas. Drowned soils and animal stomachs favor species of microbes that can survive without oxygen. These microbes respire methane (CH4) instead of carbon dioxide (CO2).
With respect to geography, both sources are plausible. The world’s largest population of ruminant livestock is in India (Northern Hemisphere tropics), and other tropical countries in Africa and South America have large populations as well. Most rice cultivation takes place in the Northern tropics, in India, China, and Southeast Asia. The tropics of both hemispheres are home to the world’s largest wetlands.
Euan Nisbet, a methane expert from Royal Holloway, University of London, thinks natural wetlands account for the lion’s share of the increase since 2007. Not only is the geography right, he explained via email, but international agricultural statistics provide no evidence for a large, matching increase in either ruminant populations or rice cultivation areas in 2007.
In contrast, it’s well documented that methane emissions from natural wetlands increase rapidly in response to rainfall and warmth and that emissions are exponentially higher in wet years than dry ones.

The seesaw between wet and dry years in the tropics is mostly governed by a natural climate pattern in the tropical Pacific Ocean that swings between a warm, dry phase (El Niño) and a cool, wet phase (La Niña). When global methane concentrations flat-lined in the early 2000s, the tropics experienced three El Niño episodes. Since 2007, La Niña has been more common, and methane emissions are once again rising.
Via email NOAA’s Dlugokencky agreed, to a point. He wrote:
While the transition from El Niño to La Niña in 2007 likely started the renewed increase.I doubt it could sustain it, especially through a subsequent strong El Niño [in 2015-16].
Also, he adds, there’s the downward trend in atmospheric carbon-13 to explain. Methane from microbial activity in natural wetlands may be depleted in carbon-13 compared to the ambient global atmosphere, but it’s not as depleted as some agricultural sources. He said:
To be consistent with the measurements of atmospheric CH4 isotopic composition, there is likely a contribution from agricultural sources, too.

Coping strategies
This focus on the details of the methane budget isn’t just a matter of scientific curiosity. Dlugokencky said:
Methane is the second most important long-lived greenhouse gas influenced by people. With relatively small reductions in emissions, we might be able to stabilize atmospheric methane or even cause it to decrease.
Both of the likely contenders for the recent increase in emissions could be tricky to mitigate. In developing countries with burgeoning populations, methane control could wind up pitted against the need to expand food production. If natural wetlands are the main source of the increase, control may not even be possible.
An impasse on both fronts might intensify the need to control emissions from other sources, including fossil fuels. If controlling methane emissions remains part of U.S. climate and air quality policy, NOAA research will help policy makers figure out where to start. Schwietzke said:
In our U.S. field measurement campaigns over the past decade, we have gained a better understanding of the mechanistic underpinnings of methane emissions from fossil fuels.
That field research has combined aircraft, satellite, and ground-based measurements of air quality to size up methane hotspots at locations all across the country, from the Four Corners region, to North Dakota and Texas, to abandoned oil and gas wells in the East. Schwietzke said:
Together with our global monitoring of all methane sources, we are making this knowledge available for use in developing mitigation strategies.
Enjoying EarthSky so far? Sign up for our free daily newsletter today!
Bottom line: After a 2000-era plateau, global levels of the greenhouse gas are hitting new highs.
Like what you read?
Subscribe and receive daily news delivered to your inbox.
More from
EarthSky Voices


