Bushfires have raged in Victoria and New South Wales since November 2019, yielding startling satellite images of smoke plumes streaming from southeastern Australia on a near daily basis. The images got even more eye-popping in January 2020 when unusually hot weather and strong winds supercharged the fires.
Narrow streams of smoke widened into a thick gray and tan pall that filled the skies on January 4, 2020. Several pyrocumulus clouds rose from the smoke, and the towering clouds functioned like elevators, lifting huge quantities of gas and particles well over 6 miles (10 km) above the surface – high enough to put smoke into the stratosphere.
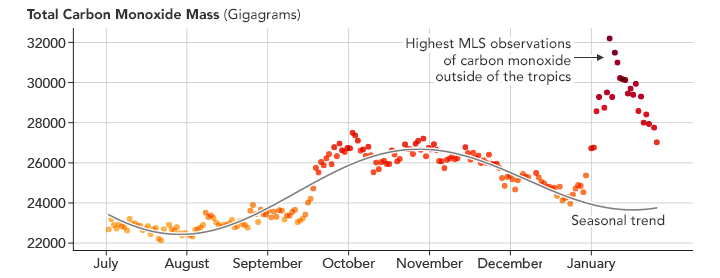
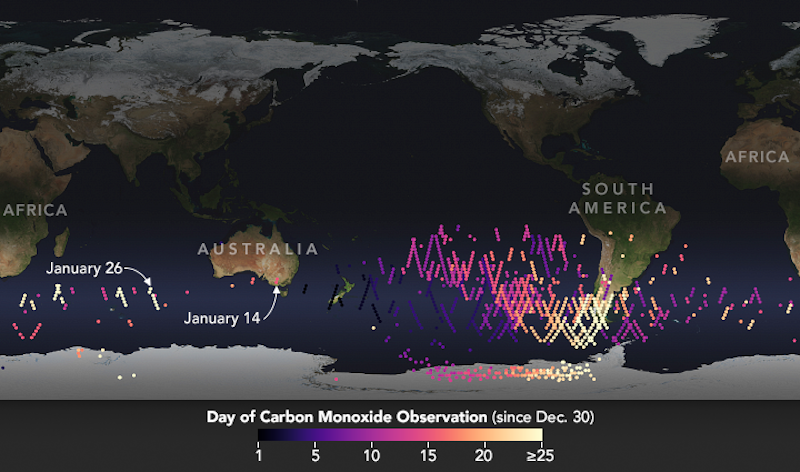
During the past few weeks, satellite sensors have collected data that is even more stunning than the images. The Microwave Limb Sounder (MLS) on NASA’s Aura satellite has collected preliminary data that suggests the Australian fires injected more carbon monoxide into the stratosphere in the month of January than any other event the sensor has observed outside of the tropics during its 15-year mission. The fires appear to have produced about three times as much of the poisonous, colorless gas as major fires in British Columbia in 2017 and Australia in 2009. (Fires in Indonesia in 2015-2016 may have delivered as much or more, but those fires happened over a longer period.)
The map above shows the locations and dates of carbon monoxide observations that MLS made in January 2020. The highest values were observed in early January as smoke crossed the Pacific Ocean. Hugh Pumphrey, an atmospheric scientist at University of Edinburgh, explained:
All of the carbon monoxide in the stratosphere will be converted into carbon dioxide over a few weeks. But the amount of carbon dioxide will not be significant for the climate. The important thing about these carbon monoxide observations is that they are a big flag being waved that point to just how unusual these fires were at the surface.
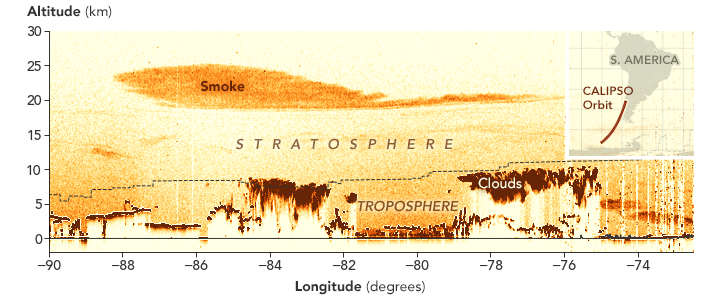
The Australian smoke is also proving to be an outlier in measurements made by the NASA/CNES CALIPSO satellite, which carries a sensor that scientists use to track the height of the smoke plume. On January 6, 2020, a few days after the most explosive fire activity, CALIPSO measured smoke 9-12 miles (15-19 km) above the surface.
Within two weeks, the top of the plume had risen as high as 15.5 miles (25 km), making this the highest wildfire-caused plume ever tracked by CALIPSO.
Jean-Paul Vernier is a scientist from the National Institute of Aerospace at NASA Langley Research Center and the lead of a NASA disasters team responding to the fires. Vernier explained:
The plume is rising because of the radiative heating of soot particles within the smoke by the sun.
A similar process caused the smoke plume from the 2017 fires in Canada to rise from its initial injection height of 7-14 miles (12-23 km) over a two-month period. In that case, satellites detected the smoke for eight months before it dissipated. Vernier said:
One of the great things about MLS and CALIPSO is that they give complementary altitude information about gases and aerosols in the atmosphere. Most satellite sensors provide a two-dimensional view of the atmosphere, but MLS and CALIPSO together offer a pretty detailed three-dimensional picture.
Bottom line: The recent wildfires in Australia sent one of the largest plumes of smoke higher into the the stratosphere than satellites have ever before observed.
Like what you read?
Subscribe and receive daily news delivered to your inbox.
More from
EarthSky Voices