


Hurricane Sandy, sonified.
By Mark Ballora, Pennsylvania State University and Jenni Evans, Pennsylvania State University
During the 2017 hurricane season, major storms in the North Atlantic devastated communities in and around Houston, Florida, Puerto Rico and the wider Caribbean.
The destruction shows how important it is to understand and communicate the serious threats that these storms pose. Scientists have made great strides in forecasting many aspects of storms, but if the people at risk don’t understand the danger they’re in, then the impact is lost.
We are colleagues from different areas of the Penn State campus: One of us is a professor of meteorology, and the other a professor of music technology. Since 2014, we have been working together to sonify the dynamics of tropical storms. In other words, we turn environmental data into music.
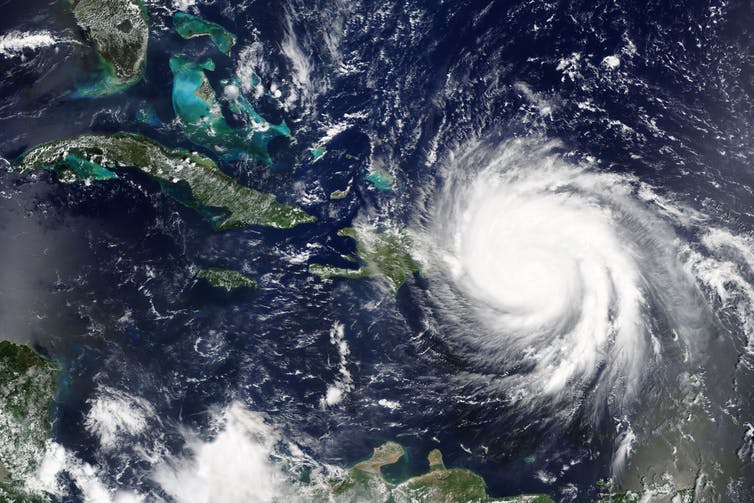
By sonifying satellite videos like those often seen in weather reports,
we hope that people will better understand how these extreme storms evolve.
Data into sound
Most of us are familiar with data visualization: charts, graphs, maps and animations that represent complex series of numbers. Sonification is an emerging field that creates graphs with sound.
As a simple example, a sonified graph might consist of a rising and falling melody, instead of a rising and falling line on a page.
A simple example of sonification.
Sonification offers a few benefits over traditional data visualization. One is accessibility: People with visual or cognitive disabilities may be better able to engage with sound-based media.
Sonification is also good for discovery. Our eyes are good at detecting static properties, like color, size and texture. But our ears are better at sensing properties that change and fluctuate. Qualities such as pitch or rhythm may change very subtly, but still be sensed quite easily. The ears are also better than the eyes at following multiple patterns simultaneously, which is what we do when we appreciate the interlocking parts in a complex piece of music.
Sound is also processed more quickly and more viscerally than visuals. That’s why we involuntarily tap our feet and sing along to a favorite song.
Turning storms into songs
A hurricane lifetime can last anywhere from a day to a few weeks. Agencies such as the U.S. National Oceanic and Atmospheric Administration continuously measure all sorts of features of a storm.
We distilled the changing characteristics of a hurricane into four features measured every six hours: air pressure, latitude, longitude and asymmetry, a measure of the pattern of the winds blowing around the storm’s center.
To create the sonifications, we export these data into the music synthesis program SuperCollider. Here, numerical values can be scaled and transposed as necessary so that, for example, a storm lasting several days can be played over just a few minutes or seconds.
Each type of data is then treated like a part in a musical score. Data are used to “play” synthesized instruments that have been created to make sounds suggestive of a storm and to blend well together.
In our recordings, air pressure is conveyed by a swirling, windy sound reflecting pressure changes. More intense hurricanes have lower values of air pressure at sea level. The winds near the ground are also stronger in intense storms.
As pressure lowers, the speed of the swirling in our sonic recordings increases, the volume increases and the windy sound becomes brighter.
This demonstration (not based on actual data) gives the sound that would result from pressure values decreasing and then increasing again.
The longitude of the storm center is reflected in stereo pan, the position of a sound source between the left and right speaker channels.
The demonstration (not based on actual data) plays longitude positions moving from west to east (left to right). (This is best heard over stereo headphones.)
Latitude is reflected in the pitch of the swirling sound, as well as in a higher, pulsing sound. As a storm moves away from the equator toward one of the poles, the pitch drops to reflect the drop in temperatures outside the tropics.
This is a demonstration (not based on actual data) of latitudes tracking away from the equator and then back toward it. Although there are a very few exceptions, storms typically do not move back toward the equator.
A more circular storm is typically more intense. Symmetry values are reflected in the brightness of a low, underlying sound. When the storm has an oblong or oval shape, the sound is brighter.
This demonstration plays values that outline the life cycle of a storm, evolving from an oval shape to becoming more circular, then returning to an oval shape. This progression reflects what would happen when a weak storm forms, becomes stronger, then dies.
Using sound
So far, we have sonified 11 storms, as well as mapped global storm activity from the year 2005.
Storm sonifications could potentially benefit those who are tracking storm systems or updating the public about weather activity. Sonifications could be played over the radio, for example. They might also be useful for people who have limited phone bandwidth and are better able to receive audio content than video content.
Even for experts in meteorology, it can be easier to get a sense of interrelated storm dynamics by hearing them as simultaneous musical parts than by relying on graphics alone. For example, while a storm’s shape is typically tied to air pressure, there are times when storms change shape without changing in air pressure. While this difference can be difficult to see in a visual graph, it’s easily heard in the sonified data.
Our goal is to introduce sonifications of all kinds of graphs into science classes, particularly those with younger students. Sonification is becoming an acknowledged research method, and several studies have proven it effective at communicating complex data. But its uptake has been slow.
Nationwide, scientists, teachers and school administrators are recognizing the importance of the arts, including sound and music, when teaching science and mathematics. If a generation of students grows up experiencing science through more of their senses – sight, hearing and touch – then they may find the sciences more inviting and less intimidating.
Mark Ballora, Professor of Music Technology, Pennsylvania State University and Jenni Evans, Professor of Meteorology, Pennsylvania State University
This article was originally published on The Conversation. Read the original article.
Like what you read?
Subscribe and receive daily news delivered to your inbox.
More from
EarthSky Voices


