


By Carol Rasmussen, NASA’s Earth Science News Team
El Niño is an unusually warm pool of water off the west coast of South America, usually arriving around Christmas time, linked with complex, large-scale interactions between the atmosphere and ocean in the Pacific.
If you live anywhere El Niño has important impacts, you’ve heard forecasters say this year’s event looks just like the monster El Niño of 1997-98.
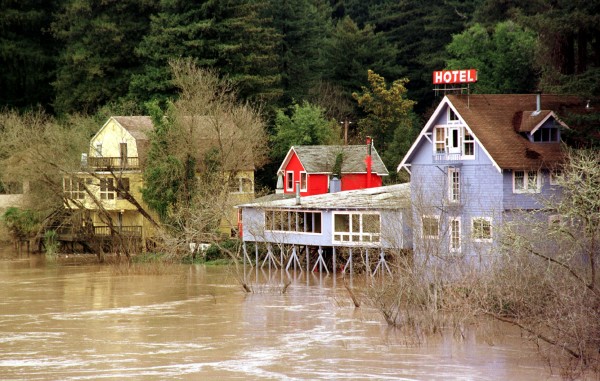
NASA satellite images of the Pacific Ocean in November 1997 and November 2015 show almost identical, large pools of warm water in the eastern equatorial Pacific. The National Weather Service has forecast that impacts this winter will resemble those in 1997, when California and the U.S. South suffered floods, mudslides and tornadoes, while residents of the Upper Midwest saved $2 billion to $7 billion in heating costs throughout their unusually warm winter.
When it comes to El Niños, however, there are no identical twins. This year’s event hasn’t always resembled the ’97 one. Satellite observations from early ’97 and early ’15 show conditions in the Pacific Ocean that were, well, oceans apart.
In its “normal” state, the Pacific is warm on the western side and cooler in the east. That’s what the ocean looked like in 1996 and early 1997. Conversely, over the past 18 months or so, satellite images have shown a large pool of warm water hovering around the equator in the central Pacific — neither west, as in a normal year, nor east, as in a typical El Niño. Tong Lee is an oceanographer at NASA’s Jet Propulsion Laboratory (JPL), in Pasadena, California. Lee said:
That warm patch started last year and it never disappeared. It’s very peculiar behavior.
In the first decade of the 2000s, scientists began noticing that warm pools were appearing more frequently in the central equatorial Pacific. Since they look like El Niños but are in the wrong place, some began calling them “central Pacific El Niños.” Others use the name “El Niño Modoki,” Japanese for (roughly) “almost but not quite an El Niño.”
Michelle Gierach studies the ocean response to El Niño at JPL. She said:
Whether we have [different] flavors of El Niño, central versus eastern Pacific El Niños, or a continuum is an actively debated topic.
However it’s classified, the central Pacific phenomenon tends to have different global impacts than the classic El Niño variety. In the United States, a strong, classic El Niño usually heralds a warmer Northwest and colder Southeast. The central Pacific version is associated with a warmer Northeast and colder Southwest.
But the central Pacific isn’t the only part of the ocean that has been behaving oddly in the last few years. Gierach said:
Before the developing 2015 El Niño, there was prolonged anomalous warming off the West Coast of North America called the Blob.
Named by Nick Bond at the University of Washington, Seattle, the Blob is the largest pool of warmer-than-normal water in the North Pacific Ocean in recorded history. It formed about two years ago near the Gulf of Alaska and grew to span the entire U.S. West Coast, merging with warm pools off Baja California and in the Bering Sea. Gierach said:
The occurrence of this phenomenon in association with El Niño is not normal, based upon our satellite record, and the combination of the two has greater potential to affect marine life.
Wherever El Niño warms the ocean, it reduces the nutrients upwelled from the ocean depth. From satellites, this can be seen in declining concentrations of sea surface chlorophyll, a green pigment found in phytoplankton. These microscopic plants are the lowest level of the ocean food web. Gierach said:
Phytoplankton, like people, have environments that they favor.
Just like any other plant, they like specific light conditions, temperatures and nutrients. When those conditions change, phytoplankton species change as well. That cascades up through the marine food chain. These changes in phytoplankton, fish and other marine life have already been observed in association with both the Blob and El Niño.
Predicting El Niños and Their Impacts
Forecasters weren’t sure how the central Pacific warm event of 2014 would shape up, and they have been cautious in predicting the evolution of this year’s event until very recently. That’s because the development of an El Niño is intrinsically difficult to forecast much more than three to six months ahead of time. Part of the difficulty is that we only have a few decades of observational records of the ocean and atmosphere to test the models used for forecasting. Since 1992, when the U.S./European Topex/Poseidon and Jason series of ocean altimetry satellites began providing comprehensive views of Pacific sea surface height (a measure of heat in the ocean), there have only been six El Niños – not a large enough sample for scientists to develop reliable assumptions on their behavior. Lee said:
The El Niño cycle is three to seven years.If you predict it wrong, you will have to wait for years to try again. Only when we have decades of satellite data can we test our prediction skill.
When it comes to forecasting the impacts of an El Niño, however, the picture is a bit different. JPL climatologist Bill Patzert said:
Forecasting the impacts for a small to medium El Niño is difficult to impossible. They’re not big enough to impact weather patterns across the planet. But when you have a super El Niño, like this year and 97-98, it’s probably the most powerful tool long-range forecasters have.
What Do the Scientists Expect?
Lee thinks the coming winter could be a double whammy. He said:
Because the warming in the central equatorial Pacific Ocean has been lingering from 2014 to 2015, and now strong warming is developing in the eastern equatorial Pacific, the question is whether in 2015 we’re going to see a combined impact.
Gierach has a wait-and-see attitude. She said:
All bets are off. Ocean conditions before the 2015 El Niño make it unclear as to what impacts we can expect. I feel like this one is an entirely different entity.
Patzert notes that what matters to anyone is not overall consequences but local ones. He said:
From day to day, the real impacts of El Niño will be individual storms. At this point, there is a wide range of possibilities. Nobody is predicting a specific mudslide here or there. Weather always does surprise you.
Enjoying EarthSky? Sign up for our free daily newsletter today!
Bottom line: NASA scientists weigh in on whether the 2016-2016 El Niño will rival the monster El Niño of 1997-1998.
Like what you read?
Subscribe and receive daily news delivered to your inbox.
More from
EarthSky Voices


